U.S. Federal Tax Brackets History
Last verified: May 20, 2026 against IRS Statistics of Income + Tax Foundation historical tables
Reviewed by Josh for financial modeling and data. See more by Josh.
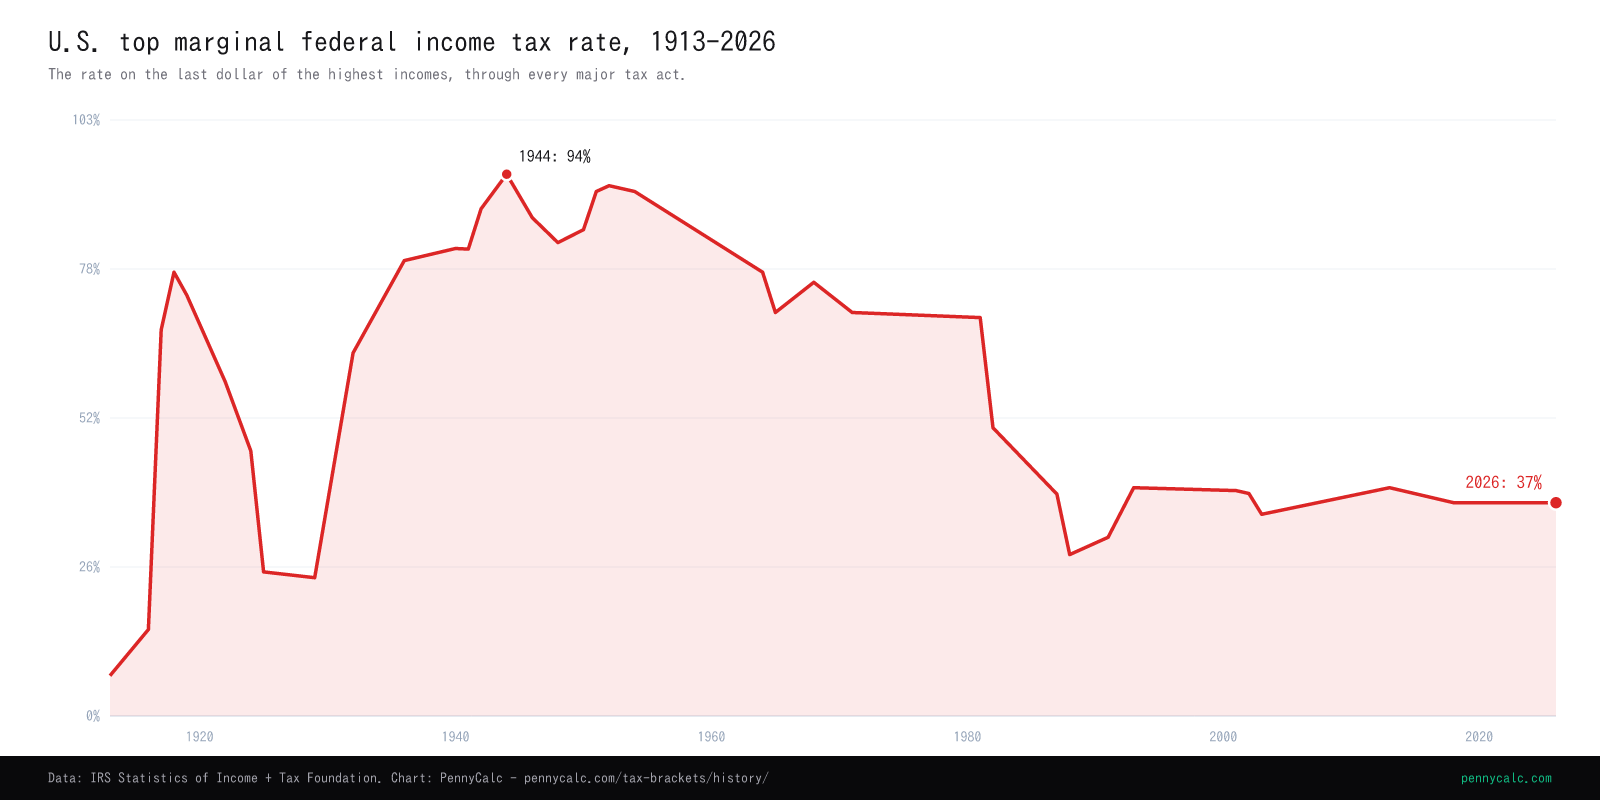
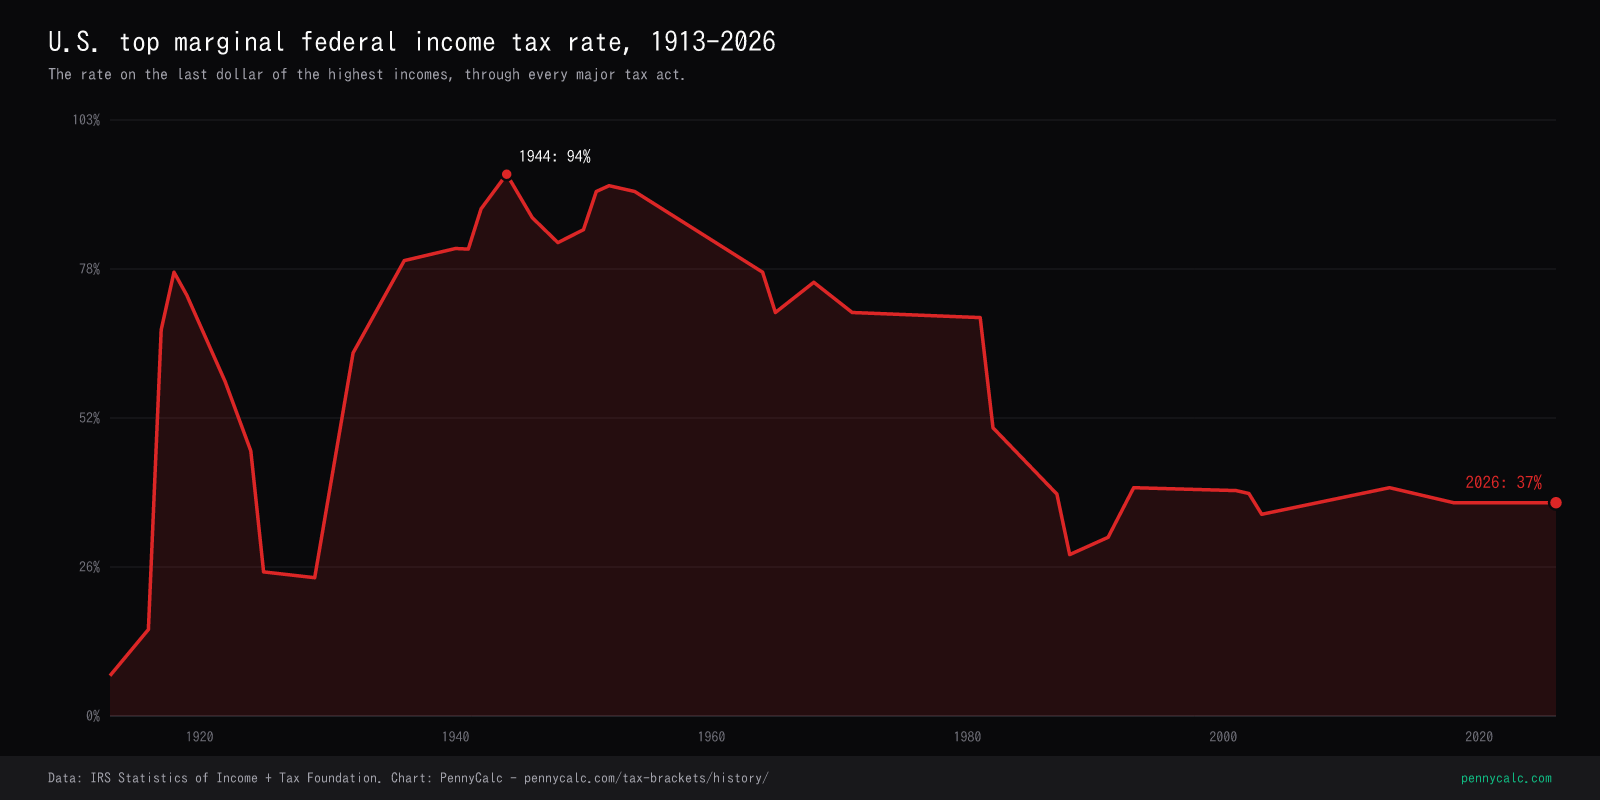
The top marginal federal income tax rate from 1913 to 2026 - every major tax act, what it changed, and why.
Sources: IRS, Tax Foundation, Joint Committee on Taxation
Download this chart: PNG light · PNG dark - PennyCalc chart artwork is reusable under CC BY 4.0 with attribution; source-data terms still apply. Licensing details.
The major tax acts, in narrative order
Tax brackets are set by Congress, not the President. Below are the legislative milestones that drove the line on the chart above.
Revenue Act of 1913 - the income tax begins
Ratification of the 16th Amendment in February 1913 cleared the constitutional barrier that had killed the federal income tax in Pollock v. Farmers' Loan & Trust (1895). The Revenue Act passed in October 1913 introduced a 1% normal tax on income over $3,000 and a graduated 1-6% surtax that brought the top rate to 7% on income above $500,000 - roughly $15M in 2026 dollars. Fewer than 1% of households filed.
WWII transforms the tax - and who pays it
The Revenue Act of 1942 raised the top rate to 88% and was called by Treasury Secretary Henry Morgenthau 'the greatest tax bill in American history.' The 1944 Individual Income Tax Act peaked the top rate at 94% on income over $200,000 and - more durably - introduced payroll withholding. Before 1944, most Americans owed no income tax. After 1944, nearly all wage earners did. The 'mass tax' was born.
Revenue Act of 1964 - Kennedy-Johnson cuts
Proposed by Kennedy and signed by Johnson, the 1964 act cut the top rate from 91% to 77% in one year, and to 70% by 1965. Brackets shrank from 24 to 14. The legislation was the first in modern memory framed explicitly as a growth-oriented cut rather than a war-finance hike or a depression-era hike.
ERTA and TRA86 - the Reagan-era restructuring
The Economic Recovery Tax Act of 1981 (ERTA, also called Kemp-Roth) cut the top rate from 70% to 50% over five years and indexed brackets to inflation for the first time. Five years later, the Tax Reform Act of 1986 went further: it collapsed 14 brackets into two (15% and 28%), broadened the base by killing dozens of shelters, and - uniquely - equalized the long-term capital gains rate with the ordinary income rate. TRA86 remains the largest base-broadening, rate-flattening reform in U.S. history. By 1988, the top rate was 28% - its lowest level since 1931.
Deficit-driven hikes
OBRA 1990 added a 31% bracket (and broke George H.W. Bush's 'read my lips' pledge). OBRA 1993 added 36% and 39.6% brackets and uncapped the Medicare wage base. By 2000, the top federal rate was 39.6% - and the federal budget was in surplus.
EGTRRA and JGTRRA - the Bush cuts
EGTRRA (2001) phased the top rate down from 39.6% to 35%, created the 10% bracket, and doubled the child tax credit. JGTRRA (2003) accelerated those cuts and dropped the long-term capital gains and qualified dividend rates to 15%. Both bills were enacted via budget reconciliation, which is why their provisions sunset - and why every Bush-era rate fight since has been about which provisions to extend.
ATRA - the 'fiscal cliff' resolution
The American Taxpayer Relief Act of 2012 (passed Jan 2, 2013) made most Bush cuts permanent but restored the 39.6% top bracket on the highest earners. Separately, the ACA's 3.8% Net Investment Income Tax took effect, and the 0.9% Additional Medicare Tax began on wage income over $200,000 / $250,000.
TCJA - largest reform since 1986
The Tax Cuts and Jobs Act lowered the top rate from 39.6% to 37%, doubled the standard deduction, capped the State and Local Tax (SALT) deduction at $10,000, killed personal exemptions, expanded the Child Tax Credit, and created the §199A pass-through deduction. Critically, the corporate cut was made permanent while individual provisions were scheduled to sunset at end of 2025. Most individual provisions were extended for 2026.
How the bracket structure has changed
The top rate is only one dimension. The number of brackets and the income thresholds where they kick in have also moved dramatically - sometimes more than the headline rate.
| Year | Brackets | Top rate | Top bracket starts (nominal $) | Top bracket starts (2026 $) |
|---|---|---|---|---|
| 1913 | 7 | 7% | $500,000 | ~$15.7M |
| 1944 | 24 | 94% | $200,000 | ~$3.5M |
| 1981 | 16 | 70% | $215,400 | ~$725K |
| 1988 | 2 | 28% | $29,750 | ~$80K |
| 2000 | 5 | 39.6% | $288,350 | ~$535K |
| 2017 | 7 | 39.6% | $418,400 | ~$540K |
| 2026 | 7 | 37% | $640,600 | $640,600 |
Bracket counts are for single filers. 2026 dollars use the BLS CPI-U deflator. The 1988 row shows TRA86's two-bracket structure, the most compressed in the modern era.
Things you might not know
- Withholding is younger than the income tax. The income tax began in 1913, but employer withholding wasn't introduced until 1944. Before then, taxpayers paid in lump sums each March.
- The U.S. once had 56 brackets. The Revenue Act of 1918 had 56 individual brackets ranging from 6% to 77%. The TRA86 collapse to 2 brackets was a 96% reduction in bracket count.
- The 1986 reform equalized capital gains with ordinary income. For the only time in modern U.S. history, long-term capital gains were taxed at the same 28% rate as wage income. JGTRRA reversed that in 2003.
- OBRA 1993 passed by one vote. Vice President Al Gore broke a 50-50 tie in the Senate to add the 36% and 39.6% brackets - the only post-1986 increase in the top rate until ATRA in 2013.
- Bracket indexation is younger than ERTA. Before 1981, brackets were defined in nominal dollars and "bracket creep" silently raised effective tax rates as inflation pushed earners into higher brackets. ERTA indexed brackets to CPI starting in 1985.
Top marginal tax rate by year
The complete year-by-year series behind the chart, from the 7% top rate of 1913 to today's 37%. Years not listed held the prior listed rate.
| Year | Top marginal rate | What changed that year |
|---|---|---|
| 1913 | 7% | 16th Amendment / Revenue Act of 1913 |
| 1916 | 15% | |
| 1917 | 67% | War Revenue Act of 1917 |
| 1918 | 77% | |
| 1919 | 73% | |
| 1922 | 58% | |
| 1924 | 46% | Mellon-era cuts (1921-1926) |
| 1925 | 25% | |
| 1929 | 24% | |
| 1932 | 63% | Revenue Act of 1932 |
| 1936 | 79% | |
| 1940 | 81.1% | |
| 1941 | 81% | |
| 1942 | 88% | Revenue Act of 1942 |
| 1944 | 94% | Individual Income Tax Act of 1944 |
| 1946 | 86.45% | |
| 1948 | 82.13% | |
| 1950 | 84.36% | |
| 1951 | 91% | |
| 1952 | 92% | |
| 1954 | 91% | |
| 1964 | 77% | Revenue Act of 1964 |
| 1965 | 70% | |
| 1968 | 75.25% | |
| 1971 | 70% | |
| 1981 | 69.125% | Economic Recovery Tax Act (ERTA) |
| 1982 | 50% | |
| 1987 | 38.5% | |
| 1988 | 28% | |
| 1991 | 31% | |
| 1993 | 39.6% | OBRA 1993 |
| 2001 | 39.1% | EGTRRA (Bush cuts, phase 1) |
| 2002 | 38.6% | |
| 2003 | 35% | JGTRRA (Bush cuts, phase 2) |
| 2013 | 39.6% | American Taxpayer Relief Act (ATRA) |
| 2018 | 37% | |
| 2026 | 37% |
Full series shown. Scroll within the table to see every year.
Frequently Asked Questions
What was the highest federal income tax rate in U.S. history?
When was the top federal tax rate at its lowest?
Are top tax rates today historically high or low?
Did people actually pay 94% in 1944?
Why does the top rate change so rarely now?
What's the difference between the top marginal rate and the effective tax rate?
What was the top tax rate the year you were born?
Pick a year from 1913 to 2026 to see the top marginal federal rate and a one-line summary of the era.
The Reagan-era tax cuts were in full swing. ERTA had cut the top rate from 70% to 50% in 1981 and indexed brackets to inflation starting in 1985.
To run real numbers against today's brackets, use our tax bracket calculator. To see how this rate stacks with state income tax in your paycheck, try the paycheck calculator. For sources and how we update this page, see our methodology.
Related Calculators
Tax Bracket Calculator
Calculate your federal income tax across all 2026 brackets.
Paycheck Calculator
Take-home pay after federal, state, FICA, and pre-tax deductions.
Capital Gains Tax History
Top federal capital gains rate from 1922 to 2026.
Standard Deduction History
How the standard deduction grew from $500 in 1944 to $16,100 today.
Methodology
How we source and verify every rate, limit, and bracket.
2026 Federal Tax Brackets
The current bracket schedule with worked examples.