Federal Minimum Wage History by Year
Facts verified: against 2 source-backed data records; page sources include DOL Wage and Hour Division current federal minimum wage
Reviewed by Michael for implementation and test coverage. See more by Michael.
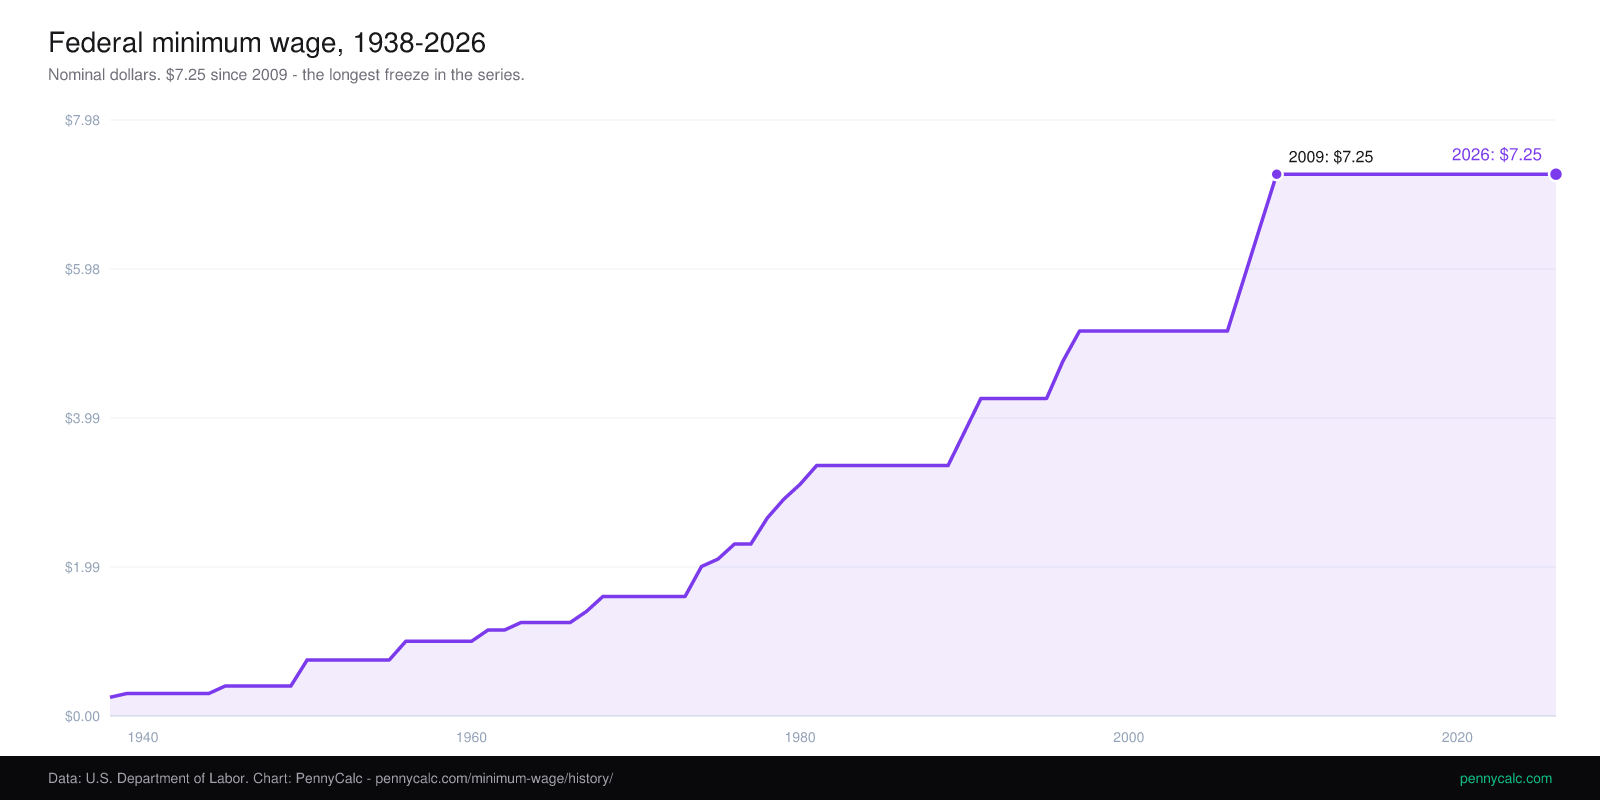
The federal minimum wage is $7.25 per hour, effective since July 24, 2009. It began at $0.25 in 1938 and has changed 22 times; this page separates actual statutory increases from years when the rate simply remained unchanged.
Primary sources: U.S. Department of Labor rate history and the BLS 2024 minimum-wage worker report.
This is the federal minimum-wage series. A state's or city's minimum in the same year may differ; this table is not a history of every state wage law.
Every federal minimum-wage increase since 1990
These are effective dates, not announcement dates. There has been no federal increase after the final row.
| Effective date | New federal rate |
|---|---|
| April 1, 1990 | $3.80 |
| April 1, 1991 | $4.25 |
| October 1, 1996 | $4.75 |
| September 1, 1997 | $5.15 |
| July 24, 2007 | $5.85 |
| July 24, 2008 | $6.55 |
| July 24, 2009 | $7.25 |
Swipe horizontally to explore the full timeline. Tap the chart to read an exact value.
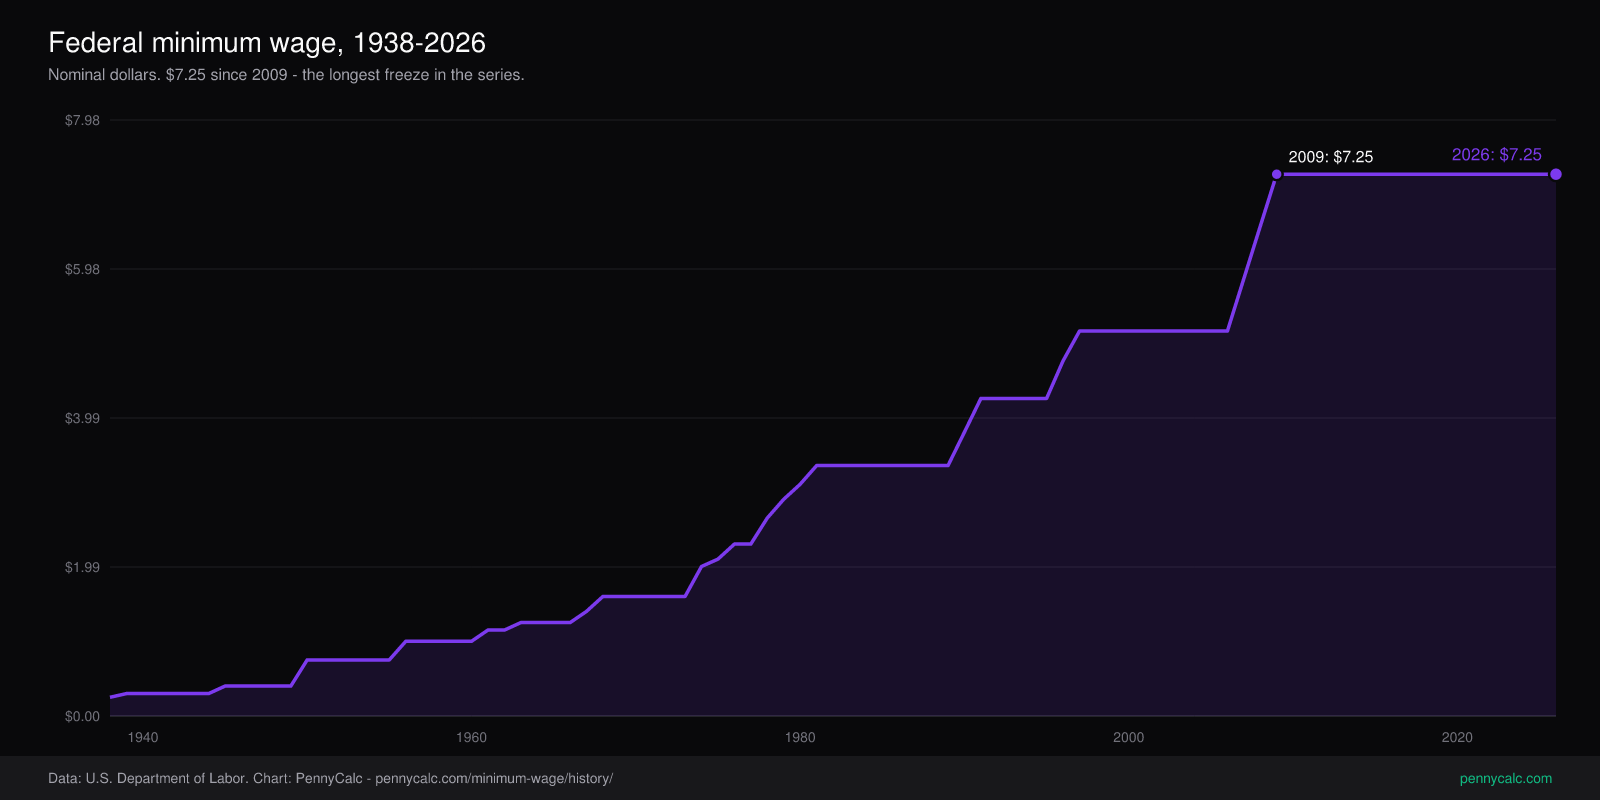
Download this chart: PNG light · PNG dark - PennyCalc chart artwork is reusable under CC BY 4.0 with attribution; source-data terms still apply. Licensing details.
The major FLSA amendments
The federal minimum wage has been raised by legislation 22 times since 1938. Below are the milestones.
Fair Labor Standards Act of 1938
The FLSA established the federal minimum wage at $0.25/hour and phased the standard workweek from 44 hours in 1938 to 40 hours in 1940. The 1938 Act covered only employees engaged in interstate commerce, which excluded most agricultural, domestic, and retail workers - roughly 20% of the labor force was actually covered. The Supreme Court upheld the FLSA in U.S. v. Darby Lumber (1941) after years of New Deal-era constitutional uncertainty.
FLSA amendments expand coverage
The 1961 amendments extended FLSA coverage to retail and service workers, hotels, restaurants, schools, hospitals, and laundries. Coverage roughly doubled. The minimum wage was raised to $1.15 for newly-covered industries (phased to $1.25 by 1965 to align with previously-covered workers). The 1961 amendments are the structural foundation for who is and is not covered by the federal minimum wage today.
Real-dollar peak: $1.60
The 1966 amendments raised the minimum to $1.60 effective 1968, the highest real-dollar value in the program's history. Using PennyCalc's explicitly estimated 2026 annual CPI, $1.60 in 1968 has the purchasing power of approximately $15.37/hour - well above today's $7.25 in real terms. Every nominal increase since 1968 has been smaller in real terms than the 1966-1968 step.
$3.35 minimum and a long pause
The minimum reached $3.35 in 1981 after the 1977 amendments' phased increases. Then the federal minimum stayed flat for nine years (1981-1989) - the longest stretch without an increase in FLSA history at that point. Inflation eroded the real value substantially during that period; by 1989, the $3.35 minimum had lost roughly 30% of its 1981 purchasing power.
Two phased increases
The 1989 FLSA amendments raised the minimum to $3.80 in 1990 and $4.25 in 1991, with a controversial $3.35 "training wage" for younger workers (later expired). The Small Business Job Protection Act of 1996 phased a further increase to $4.75 in 1996 and $5.15 in 1997. The 1996 Act bundled the minimum wage increase with small-business tax relief to win Republican support.
Last federal increase: $7.25
The Fair Minimum Wage Act of 2007 phased the minimum from $5.15 to $5.85 in 2007, $6.55 in 2008, and $7.25 in 2009. The Act passed as part of a larger Iraq War supplemental appropriations bill. The federal minimum has remained at $7.25 from July 24, 2009 to the present - a 17-year freeze that is the longest in FLSA history. In real-dollar terms, today's $7.25 buys roughly what $4.65 bought in 2009, using the page's estimated 2026 annual CPI.
State and city action filled the federal vacuum
With the federal minimum frozen, 30 states (plus DC) have set their own minimums above $7.25 as of 2026. California, Connecticut, Delaware, DC, Hawaii, Maryland, Massachusetts, New Jersey, New York, and Washington have minimums at or above $15/hour. Several major cities have minimums above $17 (Seattle, San Francisco, NYC). Most states with minimums above the federal level have indexed their minimums to inflation, ending the cycle of static-then-jumped increases that characterized the federal program.
Where the federal minimum stands today
The federal minimum wage remains at $7.25, unchanged since 2009. The 17-year freeze is unprecedented in FLSA history. In the 2024 Current Population Survey, 1.0% of hourly paid workers reported earnings at or below the federal minimum, down from 6.0% in 2010. The BLS measure does not determine FLSA coverage and excludes tips, overtime, and commissions. Multiple federal proposals have been introduced since 2009, but none has changed the statutory rate.
Things you might not know
- The federal tipped minimum is still $2.13. Set in 1991 and unchanged since. Workers in tipped occupations are covered by the federal minimum only if their hourly cash wage plus tips reaches $7.25; otherwise the employer must make up the difference. Several states require employers to pay the full minimum cash wage regardless of tips (CA, OR, WA, MN, NV, MT, AK).
- The 1938 minimum covered only ~20% of workers. The original FLSA exempted agricultural workers, domestic workers, retail workers, and service workers - large swaths of the labor force. Coverage expanded incrementally through the 1961, 1966, and 1974 amendments. Even today, certain agricultural workers, executive/professional employees, and tipped workers operate under different rules.
- The longest pre-2009 freeze was 9 years (1981-1989). The current 17-year freeze at $7.25 is nearly twice as long. Real-dollar erosion during the 1981-1989 freeze was roughly 30%; the 2009-2026 erosion has been similar in magnitude despite a starting wage that was higher in real terms.
- Most states with higher minimums now index to inflation. California, Colorado, Arizona, Nevada, Minnesota, Montana, Ohio, Oregon, South Dakota, Vermont, Washington, and DC all index their minimums to CPI (or CPI-W in some cases). This breaks the static-then-jumped pattern that characterized the federal program from 1938 through 2009.
- Subminimum wages still exist for some workers. Section 14(c) of the FLSA allows employers to pay below the minimum to workers with disabilities under specific certificates. Roughly 40,000 workers were employed under 14(c) certificates as of 2024, down from over 400,000 in 2001 (DOL WHD data). Several states have eliminated 14(c) at the state level.
The federal floor is only one part of the earnings story. Our buying-power comparison puts it beside median and mean worker earnings, with a separate household-income chart. All five use the same Census inflation method through 2025.
Federal minimum wage for every year, 1938-2026
Federal minimum wage by year
Every change to the federal minimum wage since 1938. Years not listed kept the prior rate. The wage has held at $7.25 since 2009, the longest stretch without an increase in the program's history.
| Year | Federal minimum wage | What changed that year |
|---|---|---|
| 1938 | $0.25 | Fair Labor Standards Act establishes federal minimum at $0.25 |
| 1939 | $0.30 | |
| 1940 | $0.30 | |
| 1941 | $0.30 | |
| 1942 | $0.30 | |
| 1943 | $0.30 | |
| 1944 | $0.30 | |
| 1945 | $0.40 | |
| 1946 | $0.40 | |
| 1947 | $0.40 | |
| 1948 | $0.40 | |
| 1949 | $0.40 | |
| 1950 | $0.75 | |
| 1951 | $0.75 | |
| 1952 | $0.75 | |
| 1953 | $0.75 | |
| 1954 | $0.75 | |
| 1955 | $0.75 | |
| 1956 | $1.00 | |
| 1957 | $1.00 | |
| 1958 | $1.00 | |
| 1959 | $1.00 | |
| 1960 | $1.00 | |
| 1961 | $1.15 | FLSA amendments expand coverage to retail and service workers |
| 1962 | $1.15 | |
| 1963 | $1.25 | |
| 1964 | $1.25 | |
| 1965 | $1.25 | |
| 1966 | $1.25 | |
| 1967 | $1.40 | |
| 1968 | $1.60 | Real-dollar peak: $1.60 (~$15.37 in estimated 2026 dollars) |
| 1969 | $1.60 | |
| 1970 | $1.60 | |
| 1971 | $1.60 | |
| 1972 | $1.60 | |
| 1973 | $1.60 | |
| 1974 | $2.00 | |
| 1975 | $2.10 | |
| 1976 | $2.30 | |
| 1977 | $2.30 | |
| 1978 | $2.65 | |
| 1979 | $2.90 | |
| 1980 | $3.10 | |
| 1981 | $3.35 | |
| 1982 | $3.35 | |
| 1983 | $3.35 | |
| 1984 | $3.35 | |
| 1985 | $3.35 | |
| 1986 | $3.35 | |
| 1987 | $3.35 | |
| 1988 | $3.35 | |
| 1989 | $3.35 | FLSA amendments raise minimum and create training wage |
| 1990 | $3.80 | |
| 1991 | $4.25 | |
| 1992 | $4.25 | |
| 1993 | $4.25 | |
| 1994 | $4.25 | |
| 1995 | $4.25 | |
| 1996 | $4.75 | Small Business Job Protection Act phases minimum to $5.15 |
| 1997 | $5.15 | |
| 1998 | $5.15 | |
| 1999 | $5.15 | |
| 2000 | $5.15 | |
| 2001 | $5.15 | |
| 2002 | $5.15 | |
| 2003 | $5.15 | |
| 2004 | $5.15 | |
| 2005 | $5.15 | |
| 2006 | $5.15 | |
| 2007 | $5.85 | Fair Minimum Wage Act phases minimum to $7.25 by 2009 |
| 2008 | $6.55 | |
| 2009 | $7.25 | Last federal minimum wage increase ($7.25) |
| 2010 | $7.25 | |
| 2011 | $7.25 | |
| 2012 | $7.25 | |
| 2013 | $7.25 | |
| 2014 | $7.25 | |
| 2015 | $7.25 | |
| 2016 | $7.25 | |
| 2017 | $7.25 | |
| 2018 | $7.25 | |
| 2019 | $7.25 | |
| 2020 | $7.25 | |
| 2021 | $7.25 | |
| 2022 | $7.25 | |
| 2023 | $7.25 | |
| 2024 | $7.25 | |
| 2025 | $7.25 | |
| 2026 | $7.25 |
Full series shown. Scroll within the table to see every year.
Frequently Asked Questions
What is the current federal minimum wage?
Why hasn't the federal minimum wage gone up since 2009?
What was the highest real-dollar federal minimum wage?
Which states have higher minimum wages than $7.25?
Who is covered by special minimum-wage rules or exemptions?
How many workers earn the federal minimum?
To see how a wage translates to take-home pay after federal, state, and FICA taxes, use our paycheck calculator. If you are checking a real check, the pay-stub review guide shows where to verify the pay period, hours, rate, overtime, taxes, deductions, and net pay. To compare how state taxes change the picture for similar gross wages, see the state tax comparison. For sources and update cadence, see our methodology.
Related tools and reading
Paycheck Calculator
Estimate take-home pay after federal, state, and FICA withholding.
Take-Home Pay Map
Compare take-home pay across all 50 states by salary.
Hourly to Salary Calculator
Convert any hourly wage into weekly, monthly, and annual gross pay.
Federal Tax Brackets History
Top marginal personal income tax rate from 1913 to 2026.
Social Security Wage Base History
SSA contribution and benefit base from 1937 to 2026.