Auto Loan Rate History (1972-2026): 48-Month New Car APR
Last verified: May 25, 2026 against Federal Reserve G.19 + FRED series TERMCBAUTO48NS
Reviewed by Josh for financial modeling and data. See more by Josh.
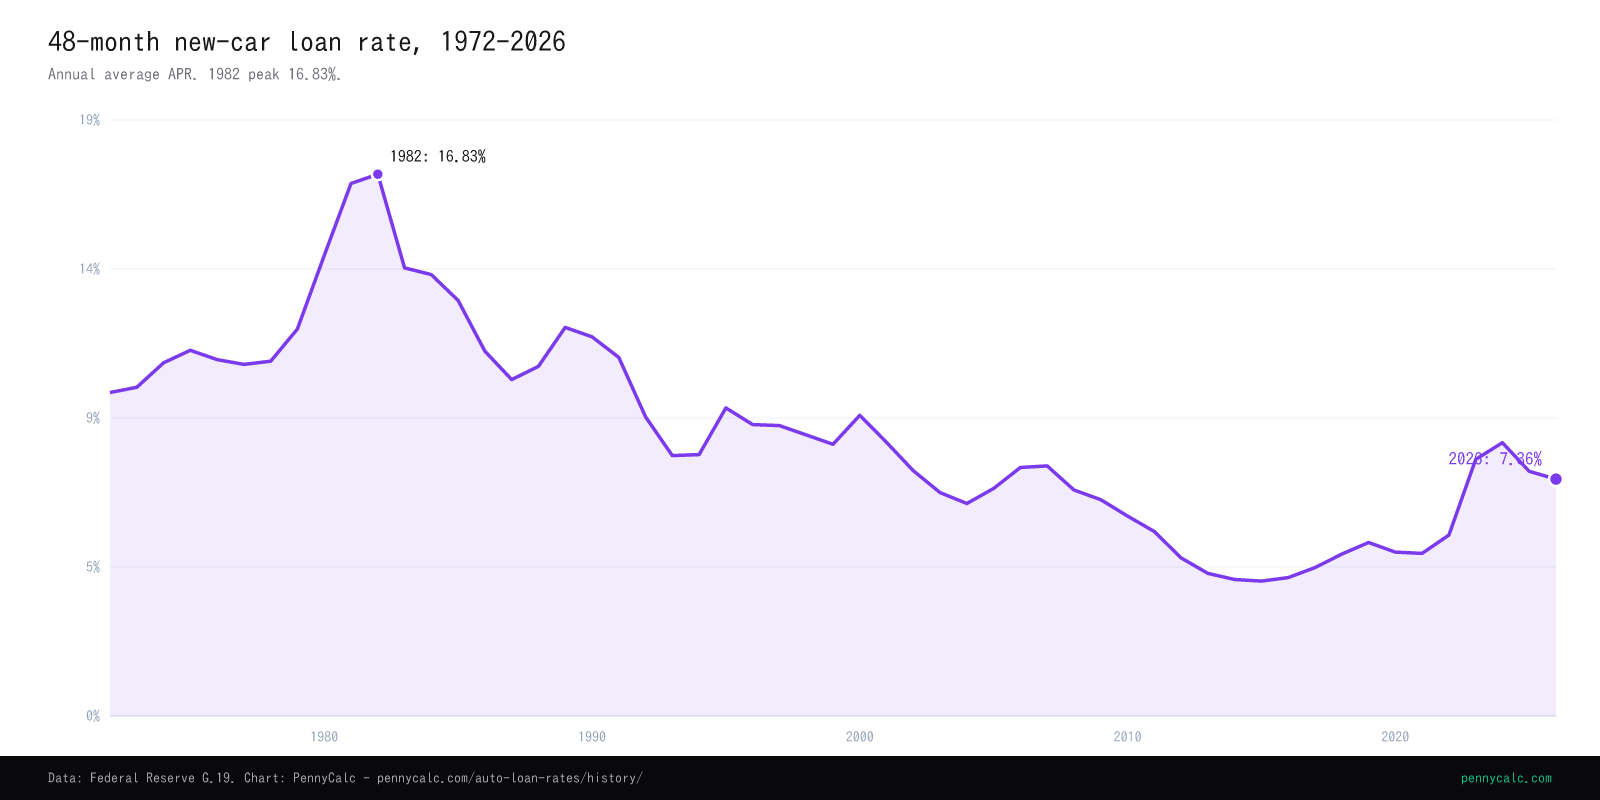
The annual average APR on a 48-month new-car loan at commercial banks, 1972 to 2026 per Federal Reserve G.19 (FRED TERMCBAUTO48NS). The rate peaked at an annual-average 16.83% in 1982 (a 17.36% monthly high in November 1981), bottomed at 4.19% in 2015, and sits near 7.36% as of February 2026. Across the full series it has averaged roughly 4 percentage points above the federal funds rate.
Sources: Federal Reserve G.19 release, FRED (TERMCBAUTO48NS, FEDFUNDS), Experian State of the Automotive Finance Market.
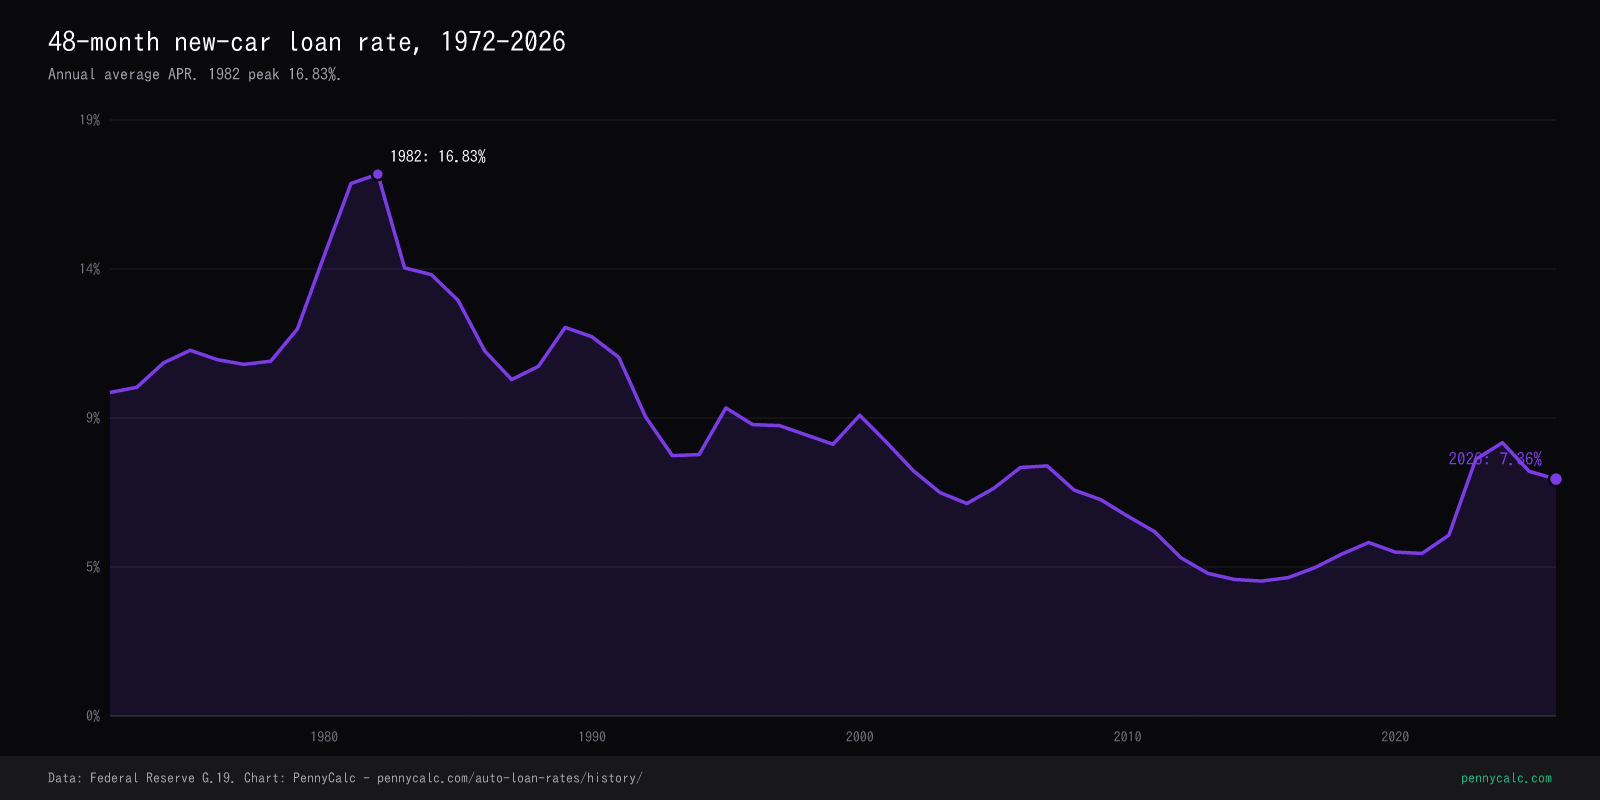
Download this chart: PNG light · PNG dark - PennyCalc chart artwork is reusable under CC BY 4.0 with attribution; source-data terms still apply. Licensing details.
The major shifts that moved auto-loan rates
The 48-month new-car APR tracks the Fed, but with a credit-risk spread layered on top that widens and narrows depending on the cycle. Below are the moves that shaped the line on the chart above. Every figure is the G.19 annual average per FRED TERMCBAUTO48NS unless noted.
Series launch and the inflationary 1970s
The Federal Reserve G.19 release began publishing the 48-month new-car loan APR at commercial banks in February 1972 (FRED TERMCBAUTO48NS). The first readings sat near 10% - the 1972 quarterly average was about 10.05% per G.19. Through the decade the rate drifted up with inflation, reaching 12.02% in 1979 per FRED. The structural break came in August 1979 when Paul Volcker took over the Fed and shifted policy toward crushing inflation expectations.
The Volcker peak - auto loans near 17%
The annual average hit 16.54% in 1981 and 16.83% in 1982, the highest in the series per FRED TERMCBAUTO48NS. The single highest monthly reading was 17.36% in November 1981. The federal funds rate averaged 16.38% in 1981 (FRED FEDFUNDS), so the gap between the auto rate and the policy rate nearly vanished - it compressed to about 0.16 percentage points, the tightest spread in the entire series. New-vehicle sales fell hard as financing costs doubled from the early-1970s baseline.
Tax Reform Act ends consumer-interest deductibility
Before 1986, interest paid on a car loan was deductible like any other consumer interest. The Tax Reform Act of 1986 phased that out (fully gone by 1991), which raised the effective after-tax cost of financing a car even when the headline APR did not move. The 48-month APR itself kept falling through the late 1980s as disinflation took hold - 11.33% in 1986 down toward 10.45% in 1987 per G.19 - but the after-tax math for borrowers got worse. This is why the mortgage-interest deduction, which survived 1986, still matters and car-loan interest does not.
0% APR financing goes mass-market
After 9/11, automakers used 0% APR promotional financing aggressively to keep showrooms moving, and it became a permanent fixture of new-car marketing. The G.19 commercial-bank series does not capture captive-lender promo rates, so the published bank APR (8.50% in 2001, falling to 6.60% by 2004 per FRED) understates how cheap subsidized manufacturer financing actually was for qualified buyers. The headline bank rate and the advertised dealer rate diverged structurally from this point on.
GFC, zero rates, and the series low
The Fed cut the federal funds rate to near zero in December 2008 and held it there for seven years (FEDFUNDS averaged 0.09% to 0.18% from 2009 through 2015). The auto rate fell more slowly and bottomed at 4.19% in 2015 per FRED TERMCBAUTO48NS - the lowest annual average in the series. Note the gap: with the policy rate near zero, the auto-loan spread blew out to roughly 5 percentage points (it averaged 5.07 pp across 2009-2015 and peaked at 6.56 pp in 2009). Auto credit carries default risk that Treasury-driven mortgage rates do not, so it never compressed to the floor.
The pandemic that did not produce a record low
This is where auto loans behaved differently from mortgages. The Fed cut to zero again in March 2020, and 30-year mortgage rates set an all-time low of 2.96% in 2021 (Freddie Mac PMMS). The 48-month auto APR, by contrast, barely moved - 5.09% in 2020 and 5.05% in 2021 per FRED, well above the 4.19% it had already reached in 2015. The reason is the credit-risk spread: auto lenders priced in pandemic uncertainty about employment and used-car values, so the policy-rate cut did not pass through the way it did for government-backed mortgage debt.
The Fed hiking cycle reverses the cheap-money era
The Fed began raising rates in March 2022 to fight roughly 9% CPI inflation. The 48-month auto APR jumped from 5.62% in 2022 to 7.97% in 2023 and 8.49% in 2024 per FRED TERMCBAUTO48NS - the highest since the early 1990s. As policy rates eased in 2025 the annual average slipped to 7.60%, and the latest monthly reading (February 2026) was 7.36% per FRED. The current rate sits below the long-run series mean of about 8.85% but well above the 2013-2021 trough.
Things you might not know
- The auto rate vs Fed funds spread is not constant. It averaged about 4 percentage points across 1972-2025 (FRED), but compressed to 0.16 pp in 1981 when policy rates spiked and blew out to 5-6.5 pp from 2009-2015 when the Fed sat at zero. The spread is widest exactly when money is supposedly cheapest.
- 0% APR financing is rarely actually 0%. Manufacturers price the subsidy into the vehicle by withholding a cash rebate you would otherwise get. The honest comparison is 0% financing against (rebate plus a cheaper outside loan), and the cash-rebate path often wins. This is also why the G.19 bank series understates how cheap subsidized dealer financing has been since the early 2000s.
- Used-car APR runs roughly 3-4 points higher than new. Per Experian's State of the Automotive Finance Market, used vehicles are riskier collateral and skew toward lower credit tiers, so the rate gap is structural, not promotional. The new-car series on this page is the low end of the market.
- 48 months is the survey baseline, but actual terms have stretched. The G.19 series is pinned to a 48-month term for consistency, yet the average new-car loan term reached a record near 70 months in 2024 (Experian). A longer term lowers the monthly payment but raises total interest and the time spent underwater on the loan.
- Credit tiers create enormous spreads. Experian's tier data shows deep-subprime borrowers paying 15-20% APR on the same car where prime borrowers pay 6-7%. The G.19 average blends all approved bank borrowers, so no individual buyer should expect to land exactly on the published number.
Year-by-year: auto APR, change, and the Fed funds rate
Every year from 1972 to 2026, with the year-over-year change in percentage points and the annual average federal funds rate alongside it (FRED FEDFUNDS) so the spread is visible. The full series is in the static HTML below and as a downloadable CSV.
Show the full 1972-2026 table
| Year | 48-mo New Car APR (%) | YoY change (pp) | Fed funds rate (avg, %) |
|---|---|---|---|
| 1972a | 10.05 | - | 4.43 |
| 1973 | 10.21 | +0.16 | 8.73 |
| 1974 | 10.97 | +0.76 | 10.50 |
| 1975 | 11.36 | +0.39 | 5.82 |
| 1976 | 11.07 | -0.29 | 5.05 |
| 1977 | 10.92 | -0.15 | 5.54 |
| 1978 | 11.02 | +0.10 | 7.93 |
| 1979 | 12.02 | +1.00 | 11.19 |
| 1980 | 14.30 | +2.28 | 13.36 |
| 1981 | 16.54 | +2.24 | 16.38 |
| 1982 | 16.83 | +0.29 | 12.26 |
| 1983 | 13.92 | -2.91 | 9.09 |
| 1984 | 13.71 | -0.21 | 10.23 |
| 1985 | 12.91 | -0.80 | 8.10 |
| 1986 | 11.33 | -1.58 | 6.81 |
| 1987 | 10.45 | -0.88 | 6.66 |
| 1988 | 10.86 | +0.41 | 7.57 |
| 1989 | 12.07 | +1.21 | 9.22 |
| 1990 | 11.78 | -0.29 | 8.10 |
| 1991 | 11.14 | -0.64 | 5.69 |
| 1992 | 9.29 | -1.85 | 3.52 |
| 1993 | 8.09 | -1.20 | 3.02 |
| 1994 | 8.12 | +0.03 | 4.20 |
| 1995 | 9.57 | +1.45 | 5.84 |
| 1996 | 9.05 | -0.52 | 5.30 |
| 1997 | 9.02 | -0.03 | 5.46 |
| 1998 | 8.73 | -0.29 | 5.35 |
| 1999 | 8.44 | -0.29 | 4.97 |
| 2000 | 9.34 | +0.90 | 6.24 |
| 2001 | 8.50 | -0.84 | 3.89 |
| 2002 | 7.62 | -0.88 | 1.67 |
| 2003 | 6.94 | -0.68 | 1.13 |
| 2004 | 6.60 | -0.34 | 1.35 |
| 2005 | 7.07 | +0.47 | 3.21 |
| 2006 | 7.72 | +0.65 | 4.96 |
| 2007 | 7.77 | +0.05 | 5.02 |
| 2008 | 7.02 | -0.75 | 1.93 |
| 2009 | 6.72 | -0.30 | 0.16 |
| 2010 | 6.21 | -0.51 | 0.18 |
| 2011 | 5.73 | -0.48 | 0.10 |
| 2012 | 4.91 | -0.82 | 0.14 |
| 2013 | 4.43 | -0.48 | 0.11 |
| 2014 | 4.24 | -0.19 | 0.09 |
| 2015 | 4.19 | -0.05 | 0.13 |
| 2016 | 4.30 | +0.11 | 0.40 |
| 2017 | 4.61 | +0.31 | 1.00 |
| 2018 | 5.03 | +0.42 | 1.83 |
| 2019 | 5.39 | +0.36 | 2.16 |
| 2020 | 5.09 | -0.30 | 0.38 |
| 2021 | 5.05 | -0.04 | 0.08 |
| 2022 | 5.62 | +0.57 | 1.68 |
| 2023 | 7.97 | +2.35 | 5.02 |
| 2024 | 8.49 | +0.52 | 5.14 |
| 2025 | 7.60 | -0.89 | 4.21 |
| 2026b | 7.36 | -0.24 | n/a |
APR is the 48-month new-car loan rate at commercial banks, FRED series TERMCBAUTO48NS; figures are FRED annual averages. Fed funds is the annual average effective rate, FRED series FEDFUNDS. a 1972 is the average of the four quarterly readings available that year; the series began February 1972, so it is a partial-year figure. b 2026 is the latest single monthly reading (February 2026), not a full-year average; the federal funds annual average for 2026 is not yet available.
A note on shopping the rate
I model financing for a living, and the single highest-leverage thing a car buyer can do is boring: get pre-qualified with a credit union or your own bank before you walk into the dealership. Not because the credit union always wins - it often does, but not always - but because a written outside offer turns the dealer's rate into a number you can evaluate instead of accept. Without a benchmark, the finance office sets the anchor.
The G.19 averages on this page are the reference point, not a quote. Take your pre-qualified rate, drop it and the dealer's offer into the auto loan calculator, and compare total cost over the full term - not just the monthly payment, which a longer term can always shrink. A half-point of APR on a 60-month loan is real money, and it is the part of the deal you have the most control over.
Frequently Asked Questions
What's the average auto loan rate today?
What was the highest auto loan rate in history?
How is auto loan APR related to the Fed funds rate?
Why do used cars have higher loan rates than new cars?
Does my credit score affect my auto loan APR? By how much?
When are auto loan rates lowest historically?
How do 0% APR offers work?
To run real numbers on a specific car and rate, use our auto loan calculator. To see how today's auto rate compares with the parallel move in home financing, see the mortgage rate history. For how we source and verify every figure, see our methodology.
Related Calculators
Auto Loan Calculator
Monthly payment, total interest, and payoff for any car price, rate, and term.
Mortgage Calculator
Payment, amortization, and total interest at any mortgage rate.
Mortgage Rate History
30-year fixed mortgage rate, annual averages from 1972 to 2026.
Federal Tax Brackets History
Top marginal federal income tax rate from 1913 to 2026.
Debt Payoff Calculator
Avalanche vs snowball payoff order and total interest saved.
Methodology
How we source and verify every rate, limit, and bracket.
This page is for educational purposes. It reports historical survey averages, not loan offers, and is not financial advice. Consult a financial professional for guidance specific to your situation.