Payroll Tax Rate History
Last verified: May 20, 2026 against SSA Office of the Chief Actuary payroll tax rate tables
Reviewed by Michael for implementation and test coverage. See more by Michael.
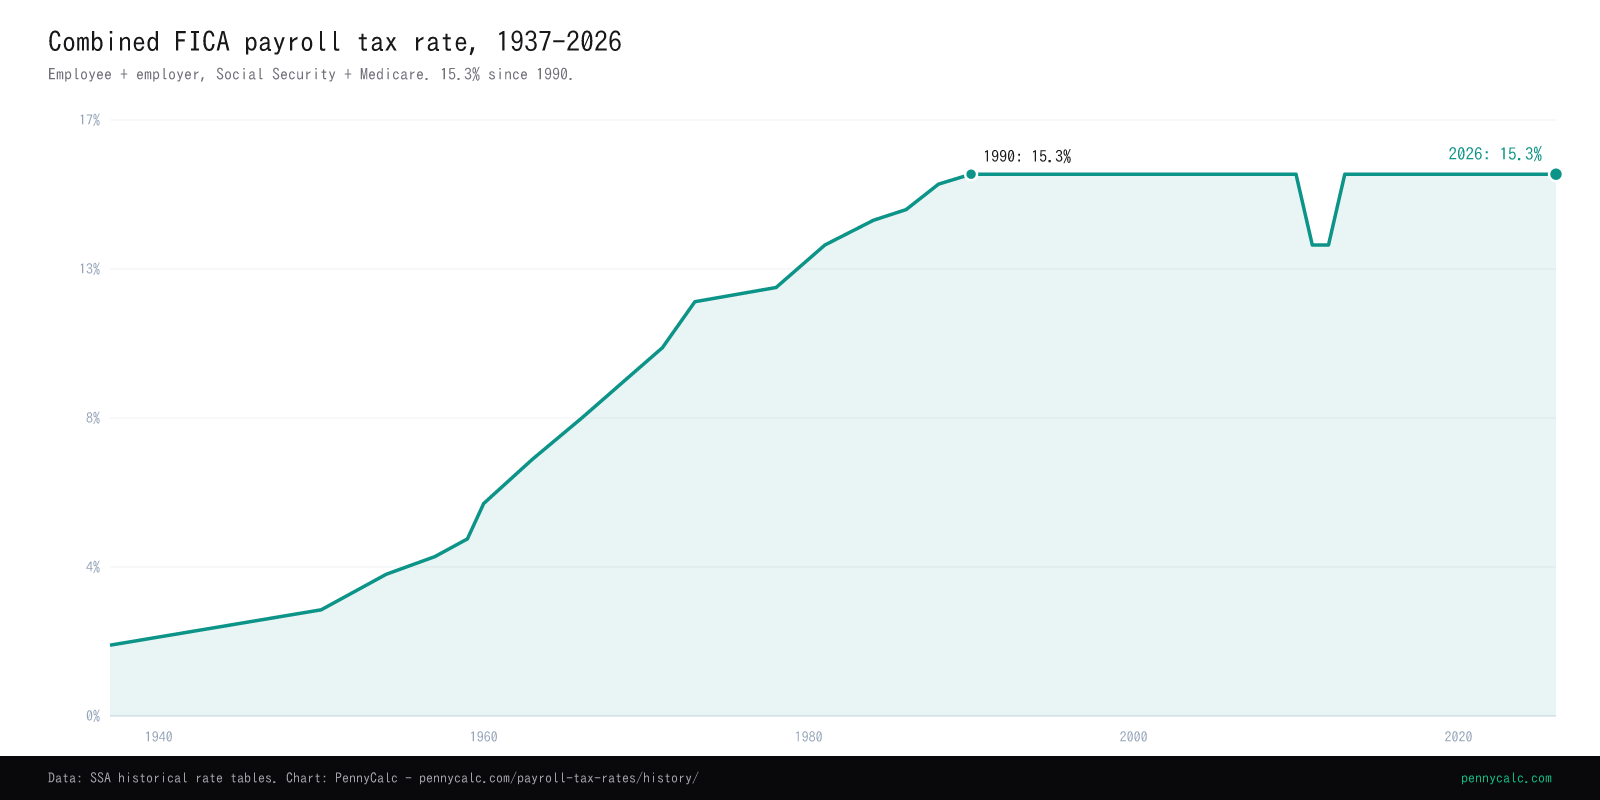
The combined FICA rate from 2% in 1937 to 15.3% today, counting both the worker\'s share and the employer\'s match, with the 2011-2012 holiday and the Medicare additions charted.
Sources: SSA Office of the Chief Actuary payroll tax rate tables and the Internal Revenue Code legislative history. Figures are combined employee-plus-employer rates.
Download this chart: PNG light · PNG dark - PennyCalc chart artwork is reusable under CC BY 4.0 with attribution; source-data terms still apply. Licensing details.
The major changes
The payroll tax rose steadily for its first 53 years, then stopped. The 15.3% combined rate set in 1990 has held ever since, which means the modern story of payroll taxes is told through the wage base and the income thresholds rather than the rate itself.
FICA begins at 1% per side
Tax collection under the Social Security Act began in 1937 at 1% from the employee and 1% from the employer, a combined 2% on the first $3,000 of wages. The original 1935 law scheduled the rate to rise to 3% per side by 1949, but a series of Congressional amendments repeatedly froze it at 1% through the 1940s. The first increase did not actually take effect until 1950. The political reluctance to raise the rate is a pattern that recurs across the whole history of the tax.
The slow climb begins
After the 1940s freeze, the rate began rising in steps: 1.5% per side in 1950, 2% in 1954, 2.5% in 1957, 3% by 1960. Each increase required legislation, and each was tied to expanding benefits and a growing beneficiary population. The combined rate doubled from 2% to 6% over the 1950s, the fastest sustained climb in the program's history.
Medicare adds the Hospital Insurance tax
When Medicare launched in 1966, it brought a new payroll tax: the Hospital Insurance (HI) tax that funds Part A, starting at 0.35% per side. This is separate from the Social Security (OASDI) tax. From 1966 forward, your FICA withholding has had two components, OASDI and Medicare, even though they appear as one line on many pay stubs. The HI rate climbed to 1.45% per side by 1986 and has held there since.
The self-employed are set to the full combined rate
Before 1984, self-employed people paid a SECA rate that was less than the full employee-plus-employer combined rate, on the theory that they should not bear the whole burden alone. The 1983 reforms changed that, setting the self-employment rate to the full 15.3% combined figure starting in 1984. To soften the increase, Congress added a deduction for half the SE tax and a temporary credit. The deduction for one-half of SE tax is still in the code today.
The rate reaches 15.3% and stops
The Social Security portion reached 6.2% per side in 1990, bringing the combined OASDI rate to 12.4%. Added to the 2.9% combined Medicare rate, total FICA hit 15.3%. That figure has not changed in over three decades. Every adjustment since has come through the wage base, the income thresholds, or new surcharges, not the headline rate. Raising the rate is politically harder than letting the wage base drift upward each year.
The payroll tax holiday
As stimulus during the slow recovery from the financial crisis, Congress temporarily cut the employee Social Security rate from 6.2% to 4.2% for 2011 and 2012. Employers kept paying 6.2%, so the combined rate fell to 13.3% rather than 15.3%. The holiday put roughly $1,000 to $2,000 a year back in a typical worker's paycheck. It is one of the largest temporary tax changes in recent memory, and also one of the most quickly forgotten, because it ran through withholding rather than a refund check.
The holiday ends and the ACA surtax begins
The payroll tax holiday expired at the end of 2012, returning the combined rate to 15.3%. The same year, the Affordable Care Act added a 0.9% Additional Medicare Tax on wages above $200,000 single or $250,000 married. It is employee-only, with no employer match, and its thresholds are not indexed to inflation, so it reaches a wider group of earners each year. This is the only piece of the modern payroll tax that is not a flat rate across all wages.
Things you might not know
- The original schedule was never followed. The 1935 law set the rate to rise to 3% per side by 1949. Congress passed a series of freeze amendments through the 1940s that kept it at 1%, delaying the first increase until 1950. Lawmakers found it easier to postpone scheduled increases than to let them take effect, a tendency that shaped the program\'s funding for decades.
- The employer half is paid by workers too, economically. Most labor economists conclude that the employer\'s 7.65% share is ultimately borne by employees in the form of lower wages. The split into employee and employer halves is a matter of how the tax is collected and how visible it is, not who bears the cost. This is why the self-employed rate of 15.3% is the honest full figure.
- The Social Security and Medicare portions diverged in 1994. Through 1993, both taxes capped at the same wage base. The 1993 budget act removed the cap on Medicare entirely, so since 1994 the 2.9% Medicare rate applies to every dollar of wages while Social Security still stops at the wage base. A high earner watches the Social Security portion of their FICA stop mid-year while the Medicare portion continues on every paycheck.
- The payroll tax holiday ran through withholding, so few people noticed. The 2011-2012 cut from 6.2% to 4.2% added up to real money, but it arrived spread across every paycheck rather than as a lump sum, so it never registered the way a stimulus check did. When it expired in 2013, the return to 6.2% felt like a pay cut to many workers who had not noticed the holiday in the first place.
- The 0.9% surtax is the only piece that is not flat. Every other part of FICA is a flat percentage of wages. The ACA Additional Medicare Tax is the exception: it applies only above $200,000 single or $250,000 married, and because those thresholds were never indexed, it quietly reaches more workers each year. It is also employee-only, the only payroll tax with no employer match.
Why we model both halves
A W-2 pay stub shows the employee's 7.65% FICA share, while the employer separately remits a matching 7.65%. Self-employed workers generally account for both shares through self-employment tax, subject to the wage base, Additional Medicare Tax rules, and the deductions available in that calculation. Showing the employee and combined rates separately makes a salary-to-contract comparison more complete. The combined Social Security and Medicare rate has been 15.3% since 1990, although the taxable wage base and additional Medicare rules have changed.
Combined FICA rate by year
The combined employee-plus-employer FICA rate behind the chart, counting both Social Security and Medicare. Years not listed held the prior rate. The rate reached 15.3% in 1990 and has stayed there since, apart from the 2011-2012 payroll tax holiday.
| Year | Combined FICA rate | What changed that year |
|---|---|---|
| 1937 | 2% | FICA begins at 1% each side (2% combined) on the first $3,000 of wages |
| 1950 | 3% | |
| 1954 | 4% | |
| 1957 | 4.5% | |
| 1959 | 5% | |
| 1960 | 6% | |
| 1963 | 7.25% | |
| 1966 | 8.4% | Medicare launches; Hospital Insurance tax adds 0.7% combined |
| 1967 | 8.8% | |
| 1969 | 9.6% | |
| 1971 | 10.4% | |
| 1973 | 11.7% | |
| 1978 | 12.1% | |
| 1981 | 13.3% | |
| 1984 | 14% | 1983 reforms set the self-employed SECA rate to the full combined rate |
| 1986 | 14.3% | |
| 1988 | 15.02% | |
| 1990 | 15.3% | OASDI reaches 6.2% per side; combined FICA hits 15.3% and holds |
| 2010 | 15.3% | |
| 2011 | 13.3% | Payroll tax holiday cuts the employee Social Security rate to 4.2% |
| 2012 | 13.3% | |
| 2013 | 15.3% | Holiday ends; ACA adds 0.9% Additional Medicare Tax above $200K/$250K |
| 2026 | 15.3% |
Full series shown. Scroll within the table to see every year.
Frequently Asked Questions
What is the 2026 payroll tax rate?
Why do self-employed people pay 15.3%?
Has the FICA rate ever gone down?
When did the payroll tax stop rising?
What is the difference between the Social Security and Medicare portions?
Does the payroll tax fund my future benefits directly?
To see FICA on your own pay, use the paycheck calculator, or the self-employment tax calculator for the full combined rate. For the income cap on the Social Security portion, see the wage base history. For sources and update cadence, see our methodology.
Related Calculators
Paycheck Calculator
See the FICA withholding on your own pay, with the wage-base cliff modeled.
Self-Employment Tax Calculator
Both halves of FICA on net earnings, with the half-SE deduction.
Social Security Wage Base History
The income cap on the Social Security portion of FICA since 1937.
Social Security COLA History
The annual benefit raise the payroll tax ultimately funds.
Tax Bracket Calculator
How income tax stacks on top of payroll tax for total burden.
Methodology
How we source and verify every rate, limit, and bracket.
Educational content only. Payroll tax rates and the wage base are set by statute and the SSA; 2026 figures reflect current law and SSA projections. Consult a qualified tax advisor for decisions specific to your situation.