U.S. Inflation History: The Purchasing Power Time Machine
Last verified: July 12, 2026 against BLS CPI-U (CUUR0000SA0) annual averages via the Federal Reserve Bank of Minneapolis, 1913-2026
Reviewed by Josh for financial modeling and data. See more by Josh.
Every year of U.S. inflation since the CPI began, what any dollar amount from any year is worth today, and the number almost nobody publishes: how fast each era actually destroyed the value of cash.
Source: BLS Consumer Price Index (CPI-U, series CUUR0000SA0), annual averages, as tabulated by the Federal Reserve Bank of Minneapolis. 2026 is the Minneapolis Fed estimate.
Pick a year. Bring money forward.
Buys the same as this in 2026
$0
And the reverse
If you had held it as cash (purchasing power, in starting-year goods)
The decay curve is what holding cash costs. The same dollars invested are a different story - see the S&P 500 time machine for the comparison.
The half-life of the dollar
Inflation calculators tell you what money was worth. This table answers the sharper question: starting from any decade, how many years did cash take to lose half its purchasing power? The answer has ranged from 7 years to "has not happened yet."
| Cash held from | Years to lose half its value | Halved by |
|---|---|---|
| 1913 | 7 years | 1920 |
| 1920 | 51 years | 1971 |
| 1930 | 37 years | 1967 |
| 1940 | 17 years | 1957 |
| 1950 | 24 years | 1974 |
| 1960 | 17 years | 1977 |
| 1970 | 10 years | 1980 |
| 1980 | 19 years | 1999 |
| 1990 | 31 years | 2021 |
| 2000 | Not yet (52% remains) | - |
| 2010 | Not yet (66% remains) | - |
Three eras stand out. Money held from 1913 or 1970 halved in about a decade - wartime finance and the oil shocks were that corrosive. Money held from 1990 took three decades to halve, the payoff of the Volcker disinflation. And 2010 cash still has about two thirds of its purchasing power sixteen years later, even after absorbing the 2021-22 spike.
The practical read: the danger of cash is not any single year of inflation, it is which regime you are living in. At the Fed's 2% target, the half-life of a dollar is about 35 years. At the 1970s pace it was under 10.
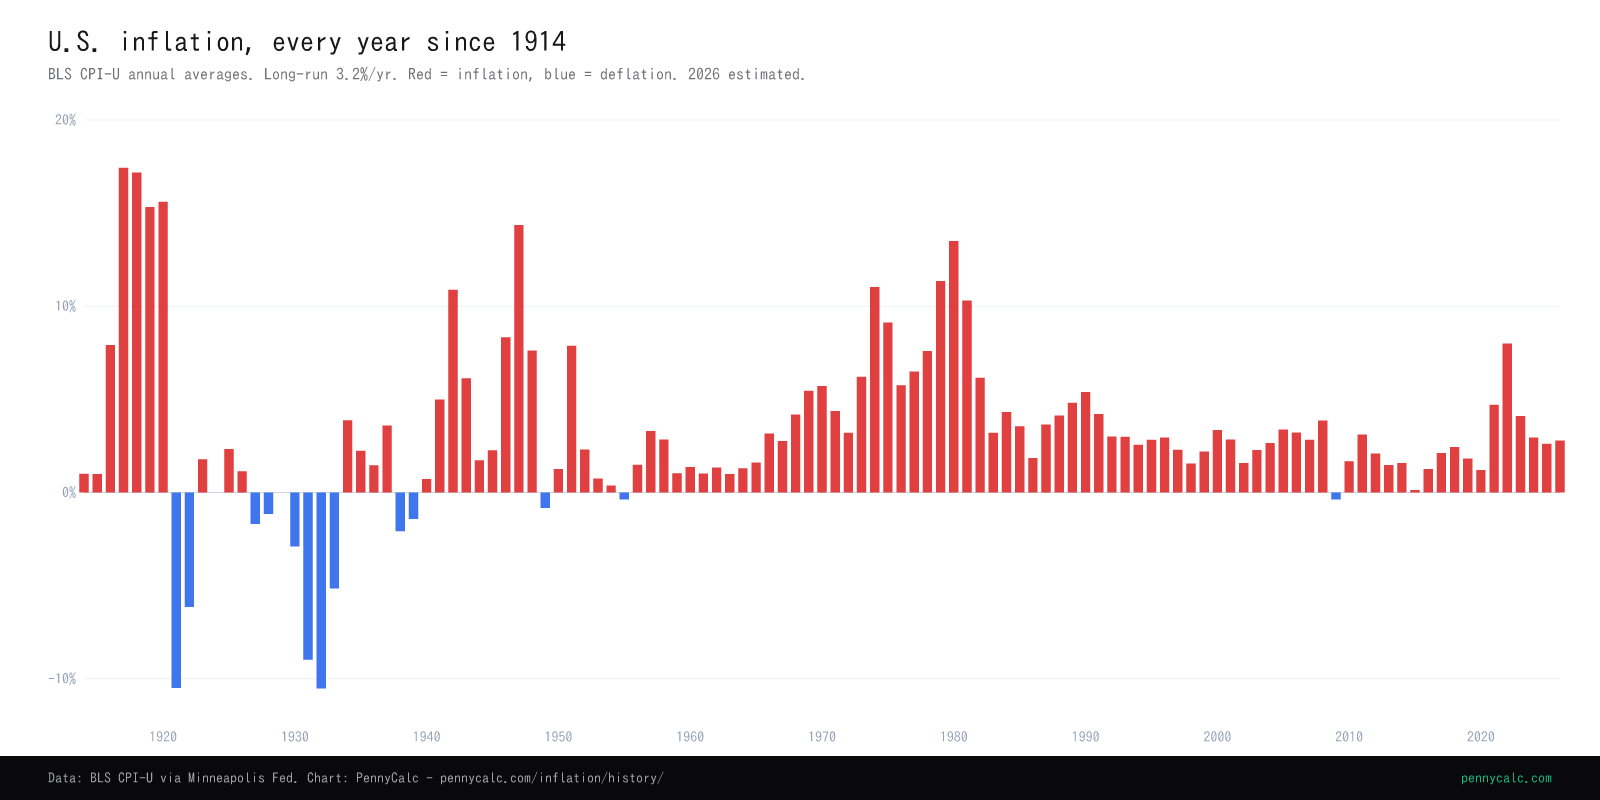
Every inflation year since 1914, in one strip
Red above the line, blue below. The pre-1950 era swings wildly in both directions; the post-Volcker era is a flat ribbon - which is exactly why 2022 felt like a regime break to anyone under 60.
The eight moments that moved the dollar
World War I finance produces back-to-back years near +18%, still the fastest annual price increases on record.
The postwar bust delivers -10.9%, the deepest one-year deflation ever measured by the CPI.
The Great Depression bottoms out. Prices fell roughly 27% from 1929 to 1933; cash was the era's best-performing asset.
WWII price controls come off and suppressed inflation arrives at once: +14.4% in a single year.
The first oil shock pushes inflation to +11.1%. The dollar of 1970 has already lost a quarter of its purchasing power.
The second oil shock peaks at +13.5%. Volcker's Fed answers with 20% policy rates, buying the next four decades of stability.
The financial crisis produces -0.4%, the only deflationary year since 1955.
Post-pandemic stimulus and supply shocks deliver +8.0%, the fastest year since 1981, and reintroduce a generation to inflation.
Things you might not know
- The worst inflation was not the 1970s. 1917 (+17.4%) and 1918 (+17.2%) both beat 1980's 13.5%. Wartime finance without a modern central bank was worse than oil shocks with one.
- Cash was the best asset of the early 1930s. Prices fell about 27% from 1929 to 1933, so uninvested dollars gained a third in purchasing power while stocks lost 80% and banks failed. Deflation is why Depression-era savers hoarded currency.
- Prices were flat for a century before the CPI. The price level in 1913 was roughly where it had been in 1813; sustained peacetime inflation is a post-gold-standard phenomenon. Every generation before 1940 expected prices to fall back after wars, and they did.
- A 1913 dollar has lost 97% of its purchasing power - and yet every diversified generation since got wealthier, because wages and asset returns compounded faster. Inflation is a tax on idle cash specifically, not on invested wealth.
- The 2021-22 spike cost savers a decade of normal erosion in two years. The price level rose 13% from 2020 to 2022 - the same loss of purchasing power that the 2010s delivered in roughly eight years.
Year-by-year table: CPI and inflation, 1913-2026
| Year | Avg CPI | Inflation | $100 then = today |
|---|---|---|---|
| 1913 | 9.9 | - | $3,342 |
| 1914 | 10.0 | +1.0% | $3,309 |
| 1915 | 10.1 | +1.0% | $3,276 |
| 1916 | 10.9 | +7.9% | $3,036 |
| 1917 | 12.8 | +17.4% | $2,585 |
| 1918 | 15.0 | +17.2% | $2,206 |
| 1919 | 17.3 | +15.3% | $1,913 |
| 1920 | 20.0 | +15.6% | $1,654 |
| 1921 | 17.9 | -10.5% | $1,849 |
| 1922 | 16.8 | -6.1% | $1,970 |
| 1923 | 17.1 | +1.8% | $1,935 |
| 1924 | 17.1 | 0.0% | $1,935 |
| 1925 | 17.5 | +2.3% | $1,891 |
| 1926 | 17.7 | +1.1% | $1,869 |
| 1927 | 17.4 | -1.7% | $1,902 |
| 1928 | 17.2 | -1.1% | $1,924 |
| 1929 | 17.2 | 0.0% | $1,924 |
| 1930 | 16.7 | -2.9% | $1,981 |
| 1931 | 15.2 | -9.0% | $2,177 |
| 1932 | 13.6 | -10.5% | $2,433 |
| 1933 | 12.9 | -5.1% | $2,565 |
| 1934 | 13.4 | +3.9% | $2,469 |
| 1935 | 13.7 | +2.2% | $2,415 |
| 1936 | 13.9 | +1.5% | $2,381 |
| 1937 | 14.4 | +3.6% | $2,298 |
| 1938 | 14.1 | -2.1% | $2,347 |
| 1939 | 13.9 | -1.4% | $2,381 |
| 1940 | 14.0 | +0.7% | $2,364 |
| 1941 | 14.7 | +5.0% | $2,251 |
| 1942 | 16.3 | +10.9% | $2,030 |
| 1943 | 17.3 | +6.1% | $1,913 |
| 1944 | 17.6 | +1.7% | $1,880 |
| 1945 | 18.0 | +2.3% | $1,838 |
| 1946 | 19.5 | +8.3% | $1,697 |
| 1947 | 22.3 | +14.4% | $1,484 |
| 1948 | 24.0 | +7.6% | $1,379 |
| 1949 | 23.8 | -0.8% | $1,390 |
| 1950 | 24.1 | +1.3% | $1,373 |
| 1951 | 26.0 | +7.9% | $1,273 |
| 1952 | 26.6 | +2.3% | $1,244 |
| 1953 | 26.8 | +0.8% | $1,235 |
| 1954 | 26.9 | +0.4% | $1,230 |
| 1955 | 26.8 | -0.4% | $1,235 |
| 1956 | 27.2 | +1.5% | $1,217 |
| 1957 | 28.1 | +3.3% | $1,178 |
| 1958 | 28.9 | +2.8% | $1,145 |
| 1959 | 29.2 | +1.0% | $1,133 |
| 1960 | 29.6 | +1.4% | $1,118 |
| 1961 | 29.9 | +1.0% | $1,107 |
| 1962 | 30.3 | +1.3% | $1,092 |
| 1963 | 30.6 | +1.0% | $1,081 |
| 1964 | 31.0 | +1.3% | $1,067 |
| 1965 | 31.5 | +1.6% | $1,050 |
| 1966 | 32.5 | +3.2% | $1,018 |
| 1967 | 33.4 | +2.8% | $991 |
| 1968 | 34.8 | +4.2% | $951 |
| 1969 | 36.7 | +5.5% | $902 |
| 1970 | 38.8 | +5.7% | $853 |
| 1971 | 40.5 | +4.4% | $817 |
| 1972 | 41.8 | +3.2% | $792 |
| 1973 | 44.4 | +6.2% | $745 |
| 1974 | 49.3 | +11.0% | $671 |
| 1975 | 53.8 | +9.1% | $615 |
| 1976 | 56.9 | +5.8% | $582 |
| 1977 | 60.6 | +6.5% | $546 |
| 1978 | 65.2 | +7.6% | $508 |
| 1979 | 72.6 | +11.3% | $456 |
| 1980 | 82.4 | +13.5% | $402 |
| 1981 | 90.9 | +10.3% | $364 |
| 1982 | 96.5 | +6.2% | $343 |
| 1983 | 99.6 | +3.2% | $332 |
| 1984 | 103.9 | +4.3% | $318 |
| 1985 | 107.6 | +3.6% | $308 |
| 1986 | 109.6 | +1.9% | $302 |
| 1987 | 113.6 | +3.6% | $291 |
| 1988 | 118.3 | +4.1% | $280 |
| 1989 | 124.0 | +4.8% | $267 |
| 1990 | 130.7 | +5.4% | $253 |
| 1991 | 136.2 | +4.2% | $243 |
| 1992 | 140.3 | +3.0% | $236 |
| 1993 | 144.5 | +3.0% | $229 |
| 1994 | 148.2 | +2.6% | $223 |
| 1995 | 152.4 | +2.8% | $217 |
| 1996 | 156.9 | +3.0% | $211 |
| 1997 | 160.5 | +2.3% | $206 |
| 1998 | 163.0 | +1.6% | $203 |
| 1999 | 166.6 | +2.2% | $199 |
| 2000 | 172.2 | +3.4% | $192 |
| 2001 | 177.1 | +2.8% | $187 |
| 2002 | 179.9 | +1.6% | $184 |
| 2003 | 184.0 | +2.3% | $180 |
| 2004 | 188.9 | +2.7% | $175 |
| 2005 | 195.3 | +3.4% | $169 |
| 2006 | 201.6 | +3.2% | $164 |
| 2007 | 207.3 | +2.8% | $160 |
| 2008 | 215.3 | +3.9% | $154 |
| 2009 | 214.5 | -0.4% | $154 |
| 2010 | 218.1 | +1.7% | $152 |
| 2011 | 224.9 | +3.1% | $147 |
| 2012 | 229.6 | +2.1% | $144 |
| 2013 | 233.0 | +1.5% | $142 |
| 2014 | 236.7 | +1.6% | $140 |
| 2015 | 237.0 | +0.1% | $140 |
| 2016 | 240.0 | +1.3% | $138 |
| 2017 | 245.1 | +2.1% | $135 |
| 2018 | 251.1 | +2.4% | $132 |
| 2019 | 255.7 | +1.8% | $129 |
| 2020 | 258.8 | +1.2% | $128 |
| 2021 | 271.0 | +4.7% | $122 |
| 2022 | 292.7 | +8.0% | $113 |
| 2023 | 304.7 | +4.1% | $109 |
| 2024 | 313.7 | +3.0% | $105 |
| 2025 | 321.9 | +2.6% | $103 |
| 2026 (est.) | 330.9 | +2.8% | $100 |
Source: BLS CPI-U annual averages via the Minneapolis Fed. 2026 is the Minneapolis Fed estimate.
Frequently Asked Questions
How is the inflation conversion calculated?
What is the long-run average U.S. inflation rate?
Has the U.S. ever had deflation?
Why does the calculator use CPI instead of another measure?
What does inflation mean for long-term investing?
Related Calculators
S&P 500 Time Machine
What $1,000 invested in any year since 1928 became - the other side of this page.
Compound Interest Calculator
Project forward in nominal or real terms.
Retirement Calculator
Inflation-adjusted withdrawals are the whole game.
Median Home Price History
Home prices 1963-2026, nominal and in today's dollars.
Social Security COLA History
How benefits have chased this exact index since 1975.
Minimum Wage History
The federal floor against the price level since 1938.