S&P 500 Return History: The $1,000 Time Machine
Last verified: July 12, 2026 against Damodaran/NYU Stern historical return dataset (histretSP), 1928-2025 annual total returns
Reviewed by Josh for financial modeling and data. See more by Josh.
Every calendar-year total return of the S&P 500 since 1928, and an interactive answer to the question everyone actually asks: what would my money have become?
Source: Aswath Damodaran, NYU Stern, Historical Returns on Stocks, Bonds and Bills. Returns include reinvested dividends.
Pick a year. Invest once.
A lump sum on January 1, held through 2025
Worth at the end of 2025
$0
CAGR
-
Best yr held
-
Worst yr held
-
Growth path (log scale)
Drag the year slider and watch the starting point change everything. Figures use calendar-year total returns; fund fees and taxes are not subtracted.
Every year since 1928, in one strip
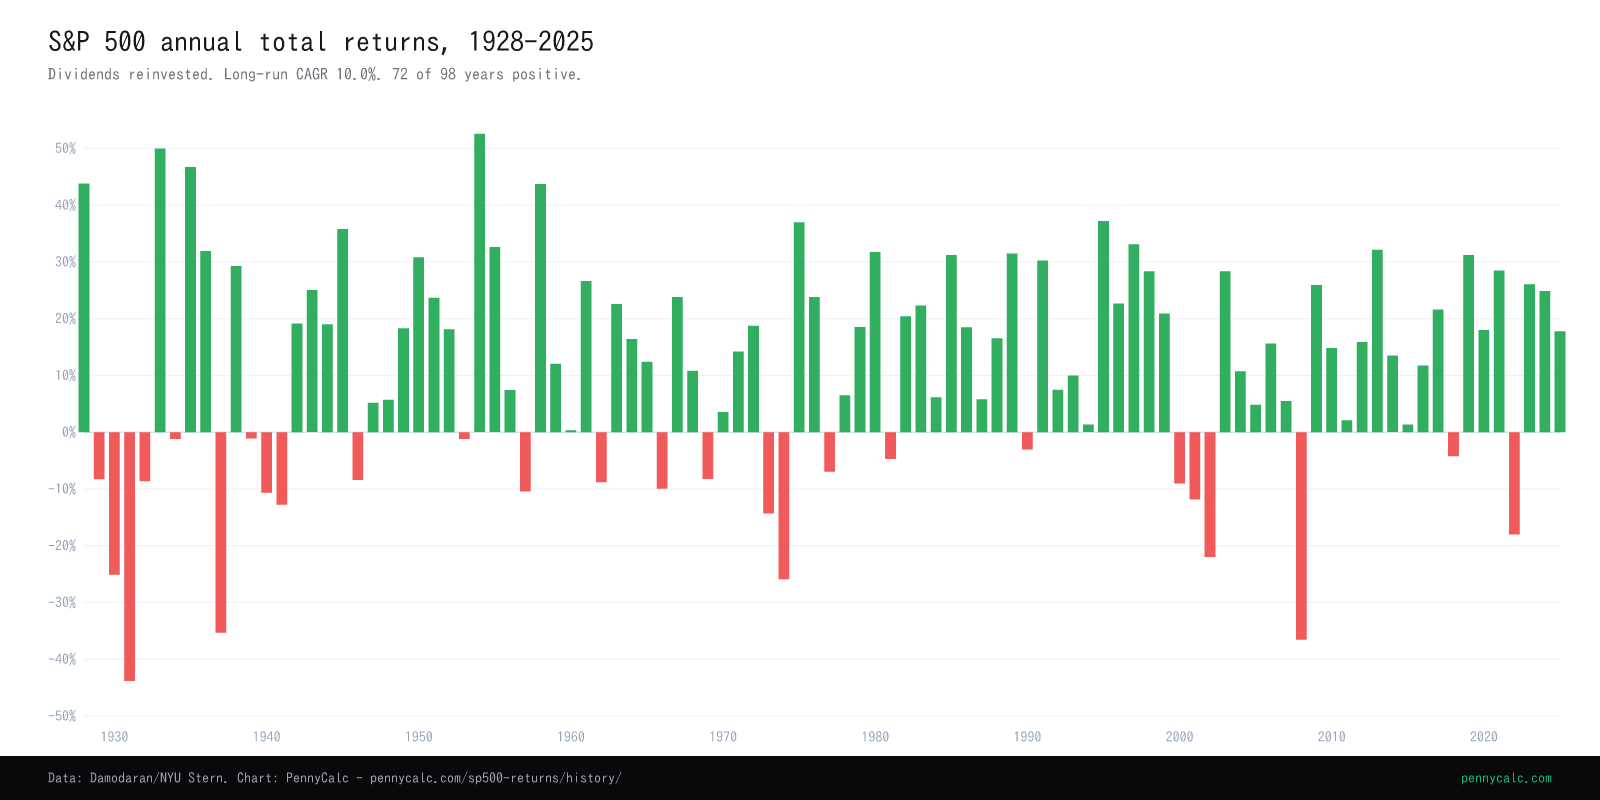
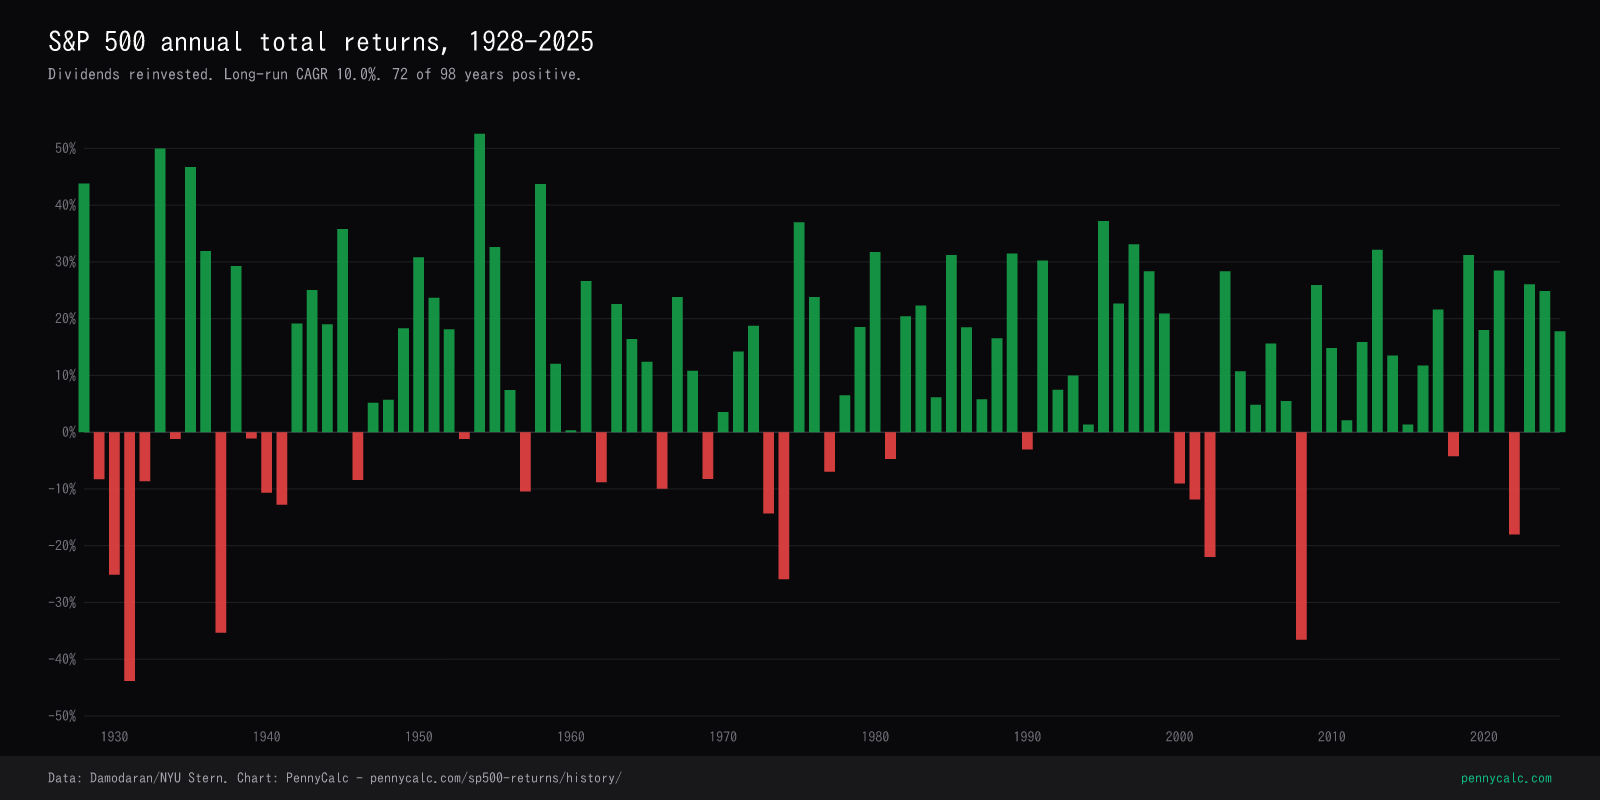
Green above the line, red below. The eye finds the story fast: losses cluster (1929-32, 1973-74, 2000-02), and the recoveries that follow are usually violent.
The crashes, and what came after
The long-run average hides the ride. These are the eight moments that shaped the strip above, with the exact calendar-year figures.
The 1929 crash begins a four-year, -86% peak-to-trough slide. The 1931 return of -43.8% is still the worst calendar year on record.
Best calendar year on record: +52.6%. The index finally regains its 1929 high a quarter century after the crash.
The 1973-74 oil-shock bear takes back-to-back years of -14.3% and -25.9%. The 1975-76 rebound returns +37.0% and +23.8%.
Black Monday drops the index 20.5% in one session, yet 1987 still closes positive at +5.8%.
The dot-com unwind strings together three losing years (2000-2002), the only three-year losing streak since the Depression.
The financial crisis produces -36.6%, the worst year since 1937. 2009 opens the recovery at +25.9%.
A -34% crash in five weeks, then the fastest recovery on record: the year still closes at +18.0%.
Rate-hike repricing takes -18.0%; 2023-24 answer with +26.1% and +24.9%.
Things you might not know
- Missing the best years is fatal to the average. Strip out just the five best years since 1928 (1933, 1935, 1954, 1958, 1928) and the long-run CAGR drops by more than a full percentage point. The best years tend to sit immediately next to the worst ones, which is why timing exits rarely works.
- 1987's crash year finished green. Black Monday took 20.5% in a single session, but the calendar year still closed at +5.8%. Annual data smooths drama that daily headlines magnify.
- The lost decade was real. $1,000 invested at the start of 2000 was worth less in March 2009 than nine years earlier. Even held all the way to the end of 2025, it grew to only about $7,400 - a CAGR under 8% and far below what a 1980 or 1990 start delivered.
- Back-to-back 25% years are rare - and recent. 2023 (+26.1%) and 2024 (+24.9%) marked the first consecutive 24%+ years since 1998-1999. The last time that happened, the following three years were all negative.
- Three of every four years are up. 72 of 98 calendar years were positive. An investor who checked their balance once a year experienced losses far less often than one who checked daily.
Year-by-year table: every return, 1928-2025
| Year | Total return | $1,000 from 1928 grows to |
|---|---|---|
| 1928 | +43.81% | $1,438 |
| 1929 | -8.30% | $1,319 |
| 1930 | -25.12% | $987 |
| 1931 | -43.84% | $555 |
| 1932 | -8.64% | $507 |
| 1933 | +49.98% | $760 |
| 1934 | -1.19% | $751 |
| 1935 | +46.74% | $1,102 |
| 1936 | +31.94% | $1,454 |
| 1937 | -35.34% | $940 |
| 1938 | +29.28% | $1,215 |
| 1939 | -1.10% | $1,202 |
| 1940 | -10.67% | $1,074 |
| 1941 | -12.77% | $936 |
| 1942 | +19.17% | $1,116 |
| 1943 | +25.06% | $1,396 |
| 1944 | +19.03% | $1,661 |
| 1945 | +35.82% | $2,256 |
| 1946 | -8.43% | $2,066 |
| 1947 | +5.20% | $2,174 |
| 1948 | +5.70% | $2,297 |
| 1949 | +18.30% | $2,718 |
| 1950 | +30.81% | $3,555 |
| 1951 | +23.68% | $4,397 |
| 1952 | +18.15% | $5,195 |
| 1953 | -1.21% | $5,132 |
| 1954 | +52.56% | $7,830 |
| 1955 | +32.60% | $10,382 |
| 1956 | +7.44% | $11,155 |
| 1957 | -10.46% | $9,988 |
| 1958 | +43.72% | $14,355 |
| 1959 | +12.06% | $16,086 |
| 1960 | +0.34% | $16,141 |
| 1961 | +26.64% | $20,441 |
| 1962 | -8.81% | $18,640 |
| 1963 | +22.61% | $22,854 |
| 1964 | +16.42% | $26,607 |
| 1965 | +12.40% | $29,906 |
| 1966 | -9.97% | $26,925 |
| 1967 | +23.80% | $33,333 |
| 1968 | +10.81% | $36,936 |
| 1969 | -8.24% | $33,892 |
| 1970 | +3.56% | $35,099 |
| 1971 | +14.22% | $40,090 |
| 1972 | +18.76% | $47,611 |
| 1973 | -14.31% | $40,798 |
| 1974 | -25.90% | $30,231 |
| 1975 | +37.00% | $41,417 |
| 1976 | +23.83% | $51,286 |
| 1977 | -6.98% | $47,706 |
| 1978 | +6.51% | $50,812 |
| 1979 | +18.52% | $60,223 |
| 1980 | +31.74% | $79,337 |
| 1981 | -4.70% | $75,608 |
| 1982 | +20.42% | $91,048 |
| 1983 | +22.34% | $111,388 |
| 1984 | +6.15% | $118,238 |
| 1985 | +31.24% | $155,176 |
| 1986 | +18.49% | $183,868 |
| 1987 | +5.81% | $194,550 |
| 1988 | +16.54% | $226,729 |
| 1989 | +31.48% | $298,103 |
| 1990 | -3.06% | $288,981 |
| 1991 | +30.23% | $376,340 |
| 1992 | +7.49% | $404,528 |
| 1993 | +9.97% | $444,859 |
| 1994 | +1.33% | $450,776 |
| 1995 | +37.20% | $618,465 |
| 1996 | +22.68% | $758,733 |
| 1997 | +33.10% | $1,009,873 |
| 1998 | +28.34% | $1,296,071 |
| 1999 | +20.89% | $1,566,820 |
| 2000 | -9.03% | $1,425,337 |
| 2001 | -11.85% | $1,256,434 |
| 2002 | -21.97% | $980,396 |
| 2003 | +28.36% | $1,258,436 |
| 2004 | +10.74% | $1,393,592 |
| 2005 | +4.83% | $1,460,902 |
| 2006 | +15.61% | $1,688,949 |
| 2007 | +5.48% | $1,781,504 |
| 2008 | -36.55% | $1,130,364 |
| 2009 | +25.94% | $1,423,580 |
| 2010 | +14.82% | $1,634,555 |
| 2011 | +2.10% | $1,668,881 |
| 2012 | +15.89% | $1,934,066 |
| 2013 | +32.15% | $2,555,868 |
| 2014 | +13.52% | $2,901,421 |
| 2015 | +1.38% | $2,941,461 |
| 2016 | +11.77% | $3,287,671 |
| 2017 | +21.61% | $3,998,137 |
| 2018 | -4.23% | $3,829,015 |
| 2019 | +31.21% | $5,024,051 |
| 2020 | +18.02% | $5,929,385 |
| 2021 | +28.47% | $7,617,481 |
| 2022 | -18.04% | $6,243,288 |
| 2023 | +26.06% | $7,870,288 |
| 2024 | +24.88% | $9,828,416 |
| 2025 | +17.78% | $11,575,908 |
Source: Damodaran/NYU Stern. Total returns include reinvested dividends; fees and taxes not subtracted.
Frequently Asked Questions
What is the average annual return of the S&P 500?
Does this data include dividends?
How often does the S&P 500 lose money in a year?
What was the worst period to start investing?
Can I invest in the S&P 500 directly?
Related Calculators
Compound Interest Calculator
Project the next 30 years at any return rate with monthly contributions.
Investment Return Calculator
Add dividends, inflation, and taxes to a growth projection.
Retirement Calculator
Test whether a balance survives a full drawdown.
Capital Gains Tax Calculator
The tax bill when you eventually sell.
Mortgage Rate History
30-year fixed rates from 1972 to 2026.
Tax Brackets History
The top marginal rate from 1913 to 2026.