New May–Oct 2026 bonds
4.26%
The current new-issue composite rate, including a 0.90% fixed rate that remains for the bond’s life.
Facts verified: against 1 source-backed data record; page sources include U.S. Treasury Series I rate tables, workbook, and 31 CFR Part 359
Reviewed by Josh for financial modeling and data. See more by Josh.
Every published I Bond fixed and inflation rate since 1998 is below, with a chart and downloadable data. The current new-issue composite rate is 4.26%. Enter the month your bond was issued to see the fixed rate it keeps for life, every six-month composite rate it has earned, and an estimated value after any early-redemption penalty.
Primary sources: Treasury rate tables, Treasury’s historical workbook, and 31 CFR Part 359.
New May–Oct 2026 bonds
4.26%
The current new-issue composite rate, including a 0.90% fixed rate that remains for the bond’s life.
May 2000 issue today
7.00%
Its 3.60% lifetime fixed rate lifts the May–October 2026 composite well above the new-bond headline rate.
May 2000 issue peak
13.39%
That vintage’s six-month annualized composite rate during the May–October 2022 inflation period.
Electronic bond estimate
Month-level inputs match Treasury’s rules: an I Bond is dated the first day of its issue month and its value changes only on monthly accrual dates.
Estimated redemption value
$11,872.00
Eligible to redeem; three-month interest penalty applies.
The fixed rate stays constant. Treasury’s semiannual inflation component changes, producing the annualized composite rate shown for each six-month earning period.
| Earning period | Fixed | Semiannual inflation | Composite |
|---|---|---|---|
| May 2022–Oct 2022 | 0.00% | 4.81% | 9.62% |
| Nov 2022–Apr 2023 | 0.00% | 3.24% | 6.48% |
| May 2023–Oct 2023 | 0.00% | 1.69% | 3.38% |
| Nov 2023–Apr 2024 | 0.00% | 1.97% | 3.94% |
| May 2024–Oct 2024 | 0.00% | 1.48% | 2.96% |
| Nov 2024–Apr 2025 | 0.00% | 0.95% | 1.90% |
| May 2025–Oct 2025 | 0.00% | 1.43% | 2.86% |
| Nov 2025–Apr 2026 | 0.00% | 1.56% | 3.12% |
| May 2026–Oct 2026 | 0.00% | 1.67% | 3.34% |
September 1998–May 2026
The blue line is the fixed rate locked in by a bond bought during each issue window. The orange line is that same new bond’s initial annualized composite rate. It is not the rate earned by every outstanding I Bond.
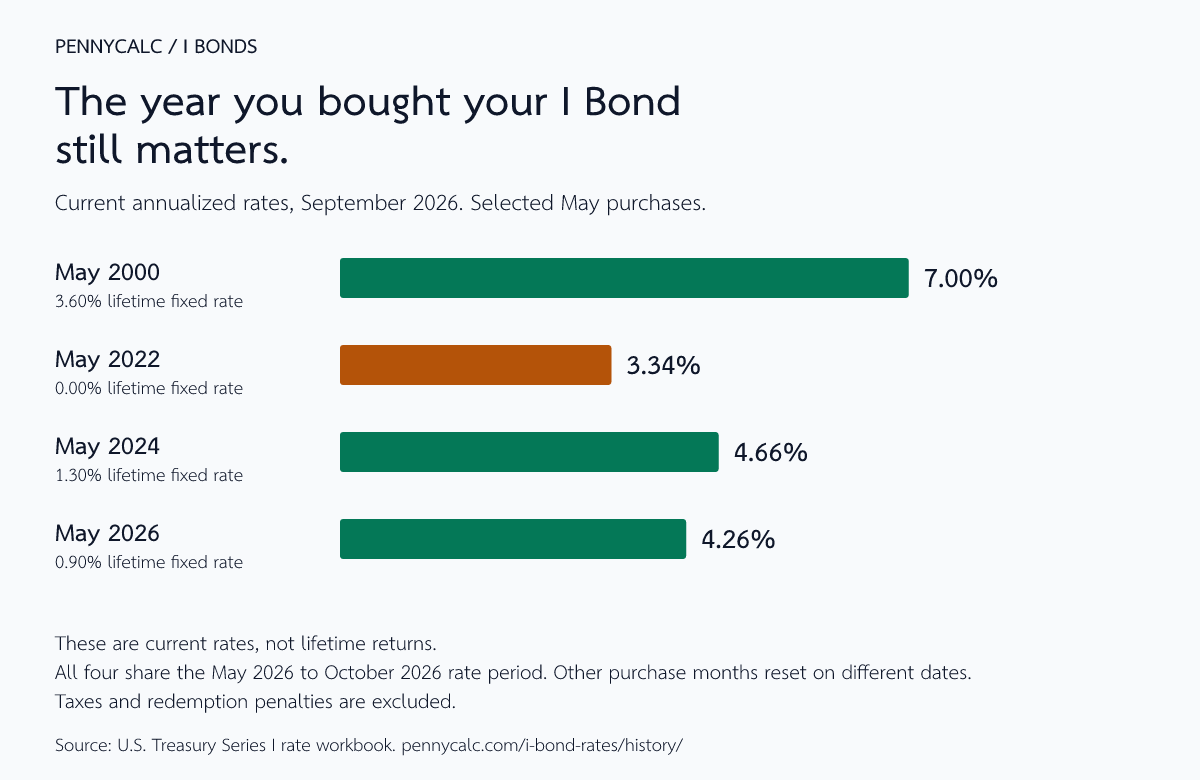
The headline rate is for a newly issued bond. An older bond keeps the fixed rate set when you bought it, so two people holding I Bonds can earn different rates today. Here are four May purchases, compared as of September 2026.
These are current annualized composite rates, not returns since purchase. All four examples share the May 2026 through October 2026 rate period. Bonds bought in other months reset on a different schedule; enter your issue month in the calculator above.
| Purchase month | Lifetime fixed rate | Current annualized rate |
|---|---|---|
| May 2000 | 3.60% | 7.00% |
| May 2022 | 0.00% | 3.34% |
| May 2024 | 1.30% | 4.66% |
| May 2026 | 0.90% | 4.26% |
The May 2022 issue started at 9.62%, but its fixed rate was zero. That initial rate was never a promise for the life of the bond. This comparison does not account for accrued interest, taxes, or early-redemption penalties, so it is not a ranking of which purchase was best.
The inflation component is a six-month percentage change; the composite is an annualized rate applied for six months. Rows are newest first.
| Issue window | Rate set | Fixed rate | Semiannual inflation | New-issue composite |
|---|---|---|---|---|
| May 2026–Oct 2026 | May 2026 | 0.90% | 1.67% | 4.26% |
| Nov 2025–Apr 2026 | Nov 2025 | 0.90% | 1.56% | 4.03% |
| May 2025–Oct 2025 | May 2025 | 1.10% | 1.43% | 3.98% |
| Nov 2024–Apr 2025 | Nov 2024 | 1.20% | 0.95% | 3.11% |
| May 2024–Oct 2024 | May 2024 | 1.30% | 1.48% | 4.28% |
| Nov 2023–Apr 2024 | Nov 2023 | 1.30% | 1.97% | 5.27% |
| May 2023–Oct 2023 | May 2023 | 0.90% | 1.69% | 4.30% |
| Nov 2022–Apr 2023 | Nov 2022 | 0.40% | 3.24% | 6.89% |
| May 2022–Oct 2022 | May 2022 | 0.00% | 4.81% | 9.62% |
| Nov 2021–Apr 2022 | Nov 2021 | 0.00% | 3.56% | 7.12% |
| May 2021–Oct 2021 | May 2021 | 0.00% | 1.77% | 3.54% |
| Nov 2020–Apr 2021 | Nov 2020 | 0.00% | 0.84% | 1.68% |
| May 2020–Oct 2020 | May 2020 | 0.00% | 0.53% | 1.06% |
| Nov 2019–Apr 2020 | Nov 2019 | 0.20% | 1.01% | 2.22% |
| May 2019–Oct 2019 | May 2019 | 0.50% | 0.70% | 1.90% |
| Nov 2018–Apr 2019 | Nov 2018 | 0.50% | 1.16% | 2.83% |
| May 2018–Oct 2018 | May 2018 | 0.30% | 1.11% | 2.52% |
| Nov 2017–Apr 2018 | Nov 2017 | 0.10% | 1.24% | 2.58% |
| May 2017–Oct 2017 | May 2017 | 0.00% | 0.98% | 1.96% |
| Nov 2016–Apr 2017 | Nov 2016 | 0.00% | 1.38% | 2.76% |
| May 2016–Oct 2016 | May 2016 | 0.10% | 0.08% | 0.26% |
| Nov 2015–Apr 2016 | Nov 2015 | 0.10% | 0.77% | 1.64% |
| May 2015–Oct 2015 | May 2015 | 0.00% | -0.80% | 0.00% |
| Nov 2014–Apr 2015 | Nov 2014 | 0.00% | 0.74% | 1.48% |
| May 2014–Oct 2014 | May 2014 | 0.10% | 0.92% | 1.94% |
| Nov 2013–Apr 2014 | Nov 2013 | 0.20% | 0.59% | 1.38% |
| May 2013–Oct 2013 | May 2013 | 0.00% | 0.59% | 1.18% |
| Nov 2012–Apr 2013 | Nov 2012 | 0.00% | 0.88% | 1.76% |
| May 2012–Oct 2012 | May 2012 | 0.00% | 1.10% | 2.20% |
| Nov 2011–Apr 2012 | Nov 2011 | 0.00% | 1.53% | 3.06% |
| May 2011–Oct 2011 | May 2011 | 0.00% | 2.30% | 4.60% |
| Nov 2010–Apr 2011 | Nov 2010 | 0.00% | 0.37% | 0.74% |
| May 2010–Oct 2010 | May 2010 | 0.20% | 0.77% | 1.74% |
| Nov 2009–Apr 2010 | Nov 2009 | 0.30% | 1.53% | 3.36% |
| May 2009–Oct 2009 | May 2009 | 0.10% | -2.78% | 0.00% |
| Nov 2008–Apr 2009 | Nov 2008 | 0.70% | 2.46% | 5.64% |
| May 2008–Oct 2008 | May 2008 | 0.00% | 2.42% | 4.84% |
| Nov 2007–Apr 2008 | Nov 2007 | 1.20% | 1.53% | 4.28% |
| May 2007–Oct 2007 | May 2007 | 1.30% | 1.21% | 3.74% |
| Nov 2006–Apr 2007 | Nov 2006 | 1.40% | 1.55% | 4.52% |
| May 2006–Oct 2006 | May 2006 | 1.40% | 0.50% | 2.41% |
| Nov 2005–Apr 2006 | Nov 2005 | 1.00% | 2.85% | 6.73% |
| May 2005–Oct 2005 | May 2005 | 1.20% | 1.79% | 4.80% |
| Nov 2004–Apr 2005 | Nov 2004 | 1.00% | 1.33% | 3.67% |
| May 2004–Oct 2004 | May 2004 | 1.00% | 1.19% | 3.39% |
| Nov 2003–Apr 2004 | Nov 2003 | 1.10% | 0.54% | 2.19% |
| May 2003–Oct 2003 | May 2003 | 1.10% | 1.77% | 4.66% |
| Nov 2002–Apr 2003 | Nov 2002 | 1.60% | 1.23% | 4.08% |
| May 2002–Oct 2002 | May 2002 | 2.00% | 0.28% | 2.57% |
| Nov 2001–Apr 2002 | Nov 2001 | 2.00% | 1.19% | 4.40% |
| May 2001–Oct 2001 | May 2001 | 3.00% | 1.44% | 5.92% |
| Nov 2000–Apr 2001 | Nov 2000 | 3.40% | 1.52% | 6.49% |
| May 2000–Oct 2000 | May 2000 | 3.60% | 1.91% | 7.49% |
| Nov 1999–Apr 2000 | Nov 1999 | 3.40% | 1.76% | 6.98% |
| May 1999–Oct 1999 | May 1999 | 3.30% | 0.86% | 5.05% |
| Nov 1998–Apr 1999 | Nov 1998 | 3.30% | 0.86% | 5.05% |
| Sep 1998–Oct 1998 | Sep 1998 | 3.40% | 0.62% | 4.66% |
Source data retrieved 2026-08-30. Historical values use Treasury-published rates rather than recomputing revised CPI observations.
An I Bond combines two numbers. The fixed rate is set when the bond is issued and remains for its 30-year interest-bearing life. The semiannual inflation rate changes every six months. In the formula below, “inflation” means that semiannual rate. Treasury combines the two rates rather than simply adding them:
composite = fixed + (2 × inflation) + (fixed × inflation) / 100
The result is rounded to the nearest hundredth of a percentage point and cannot fall below 0%. Interest accrues monthly and compounds every six months. An April bond, for example, resets each April and October - even though Treasury announces new inflation components in May and November.
Treasury generally prevents redemption of a modern I Bond for its first 12 months. Before the five-year anniversary, its redemption value is calculated as though it were redeemed three months earlier. The calculator therefore shows both the value before that adjustment and the amount currently payable. At five years, the penalty disappears automatically.
Treasury first calculates and rounds the value of a $25 unit under 31 CFR 359.19, derives the corresponding $100 definitive-bond redemption value, and then prorates that $100 value to the electronic purchase amount under 31 CFR 359.55. PennyCalc follows that sequence rather than compounding the user-entered amount directly, but only the balance inside TreasuryDirect is an official quote.
I Bond interest is subject to federal income tax but exempt from state and local income tax. Owners may generally defer federal reporting until redemption or maturity or elect annual reporting. A higher-education exclusion may apply only when its ownership, age, income, filing-status, and expense rules are met. See Treasury’s tax guidance and redemption guidance before acting.
PennyCalc uses an original presentation of public rate facts and does not reproduce Treasury’s chart artwork, branding, or account data.
Data version: rates through 2026-05-01, verified 2026-08-30. The generated CSV and JSON are rebuilt from the same canonical rate module as this page. The verification date changes only after the Treasury tables, workbook, and calculation rules are reviewed.
Inflation changes what both savings and earnings can buy. Our buying-power history follows worker earnings and household income on the same inflation basis.
See CPI inflation by year and compare purchasing power over time.
Model recurring contributions and compounding at any assumed rate.
Work backward from a target balance and deadline.
Compare the very different risk and return history of U.S. stocks.
See how much of an S&P 500 index-fund proxy sits in its largest stocks and sectors.
Compare a Treasury savings bond with the distribution of household stock ownership.
Test savings, withdrawals, and retirement timing together.