Social Security COLA by Year (1975-2026): Complete History
Last verified: July 21, 2026 against SSA COLA history + 2026 COLA fact sheet
Reviewed by Jessie for editorial clarity and sourcing. See more by Jessie.
The 2026 Social Security COLA is 2.8%. Below are the last 10 years and every automatic cost-of-living adjustment since 1975, including the 14.3% record and all three years with no increase.
Primary sources: SSA Office of the Chief Actuary historical COLA series and the SSA 2026 COLA fact sheet. We show both SSA's effective year and the year the larger check is first paid.
Social Security COLA for the last 10 years
These are the common first-payment-year labels used in SSA fact sheets and beneficiary communications. The adjacent column shows the earlier year used in SSA's historical effective-date table.
| First payment year | SSA effective year | COLA | Increase on $2,000/mo. |
|---|---|---|---|
| 2026 | December 2025 | 2.8% | +$56 |
| 2025 | December 2024 | 2.5% | +$50 |
| 2024 | December 2023 | 3.2% | +$64 |
| 2023 | December 2022 | 8.7% | +$174 |
| 2022 | December 2021 | 5.9% | +$118 |
| 2021 | December 2020 | 1.3% | +$26 |
| 2020 | December 2019 | 1.6% | +$32 |
| 2019 | December 2018 | 2.8% | +$56 |
| 2018 | December 2017 | 2.0% | +$40 |
| 2017 | December 2016 | 0.3% | +$6 |
What does the 2.8% COLA add to a monthly benefit?
Multiply the gross monthly benefit by 2.8%. These examples show the increase before Medicare premiums, tax withholding, or other deductions.
Complete Social Security COLA history by year
Why are there two year columns? Through the July 1982 increase, the first-payment year and SSA's historical year match. The 1983 reforms moved the next adjustment to December 1983, payable in January 1984. SSA's actuarial series therefore calls that adjustment 1983, while public fact sheets and recipients call it the 1984 COLA. That timing shift is also why there is no first-payment-year 1983 row. Showing both labels makes the official series and the check-year convention directly comparable.
| First payment year | SSA effective year | COLA | What changed |
|---|---|---|---|
| 2026 | 2025 | 2.8% | 2.8% COLA, effective December 2025 and first paid in January 2026 |
| 2025 | 2024 | 2.5% | |
| 2024 | 2023 | 3.2% | |
| 2023 | 2022 | 8.7% | 8.7% COLA, the largest since 1981, after the post-pandemic inflation spike |
| 2022 | 2021 | 5.9% | |
| 2021 | 2020 | 1.3% | |
| 2020 | 2019 | 1.6% | |
| 2019 | 2018 | 2.8% | |
| 2018 | 2017 | 2.0% | |
| 2017 | 2016 | 0.3% | |
| 2016 | 2015 | 0.0% | |
| 2015 | 2014 | 1.7% | |
| 2014 | 2013 | 1.5% | |
| 2013 | 2012 | 1.7% | |
| 2012 | 2011 | 3.6% | |
| 2011 | 2010 | 0.0% | |
| 2010 | 2009 | 0.0% | First-ever 0% COLA after the 2008-09 deflationary shock; repeated in 2011 |
| 2009 | 2008 | 5.8% | |
| 2008 | 2007 | 2.3% | |
| 2007 | 2006 | 3.3% | |
| 2006 | 2005 | 4.1% | |
| 2005 | 2004 | 2.7% | |
| 2004 | 2003 | 2.1% | |
| 2003 | 2002 | 1.4% | |
| 2002 | 2001 | 2.6% | |
| 2001 | 2000 | 3.5% | |
| 2000 | 1999 | 2.5% | |
| 1999 | 1998 | 1.3% | |
| 1998 | 1997 | 2.1% | |
| 1997 | 1996 | 2.9% | |
| 1996 | 1995 | 2.6% | |
| 1995 | 1994 | 2.8% | |
| 1994 | 1993 | 2.6% | |
| 1993 | 1992 | 3.0% | |
| 1992 | 1991 | 3.7% | |
| 1991 | 1990 | 5.4% | |
| 1990 | 1989 | 4.7% | |
| 1989 | 1988 | 4.0% | |
| 1988 | 1987 | 4.2% | |
| 1987 | 1986 | 1.3% | |
| 1986 | 1985 | 3.1% | |
| 1985 | 1984 | 3.5% | |
| 1984 | 1983 | 3.5% | Greenspan reforms shift the COLA from July to January, skipping a 1983 increase |
| 1982 | 1982 | 7.4% | |
| 1981 | 1981 | 11.2% | |
| 1980 | 1980 | 14.3% | Highest COLA on record: 14.3%, driven by late-1970s inflation |
| 1979 | 1979 | 9.9% | |
| 1978 | 1978 | 6.5% | |
| 1977 | 1977 | 5.9% | |
| 1976 | 1976 | 6.4% | |
| 1975 | 1975 | 8.0% | Automatic annual COLA begins; before this, increases required an act of Congress |
All 51 automatic adjustments are in the static table. The first-payment-year view runs from 1975 to 2026 with no 1983 row because of the one-time timing shift described above.
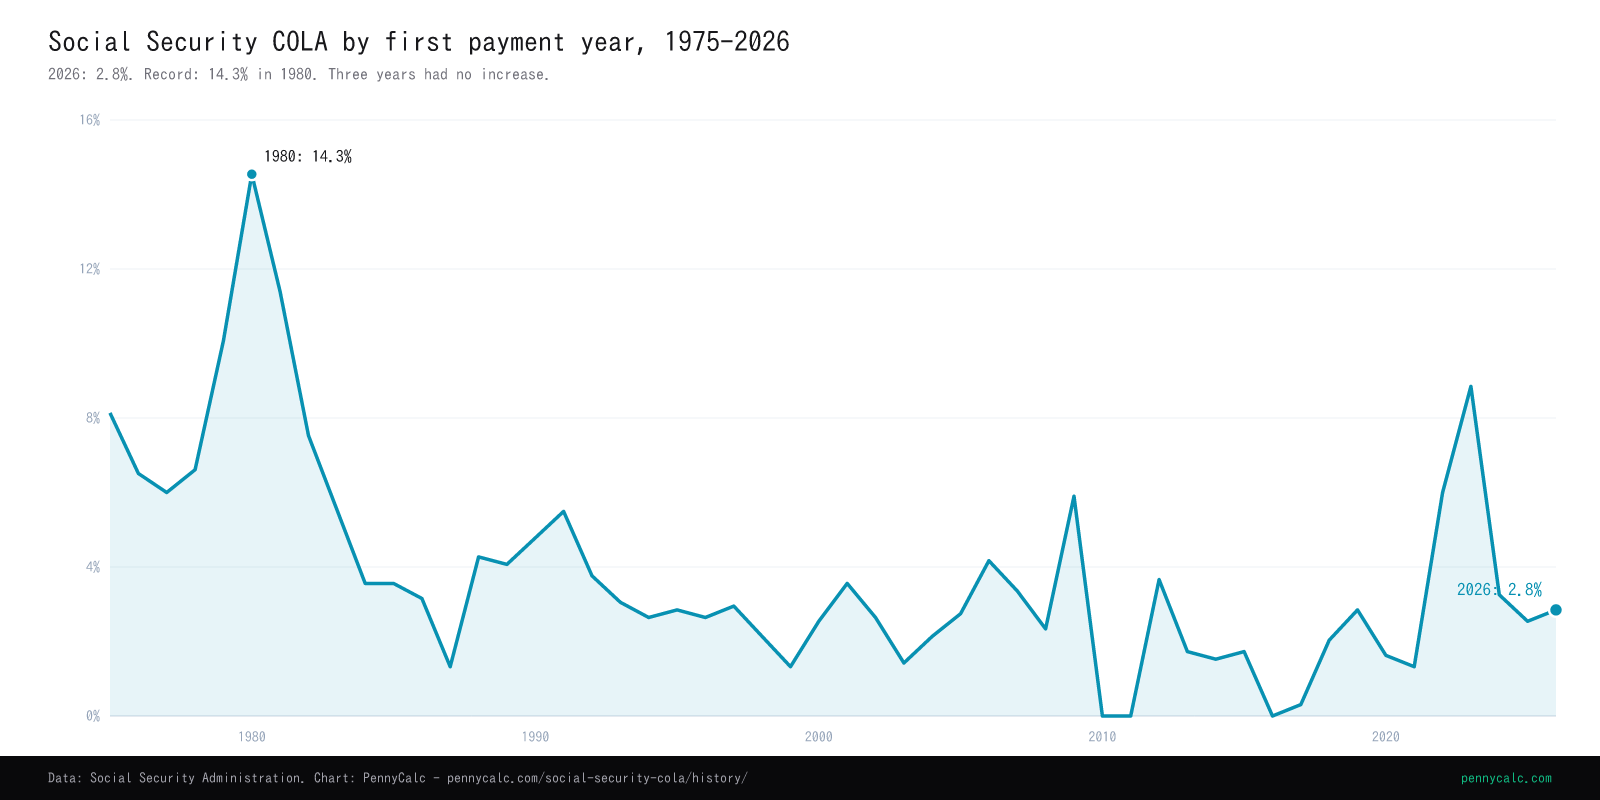
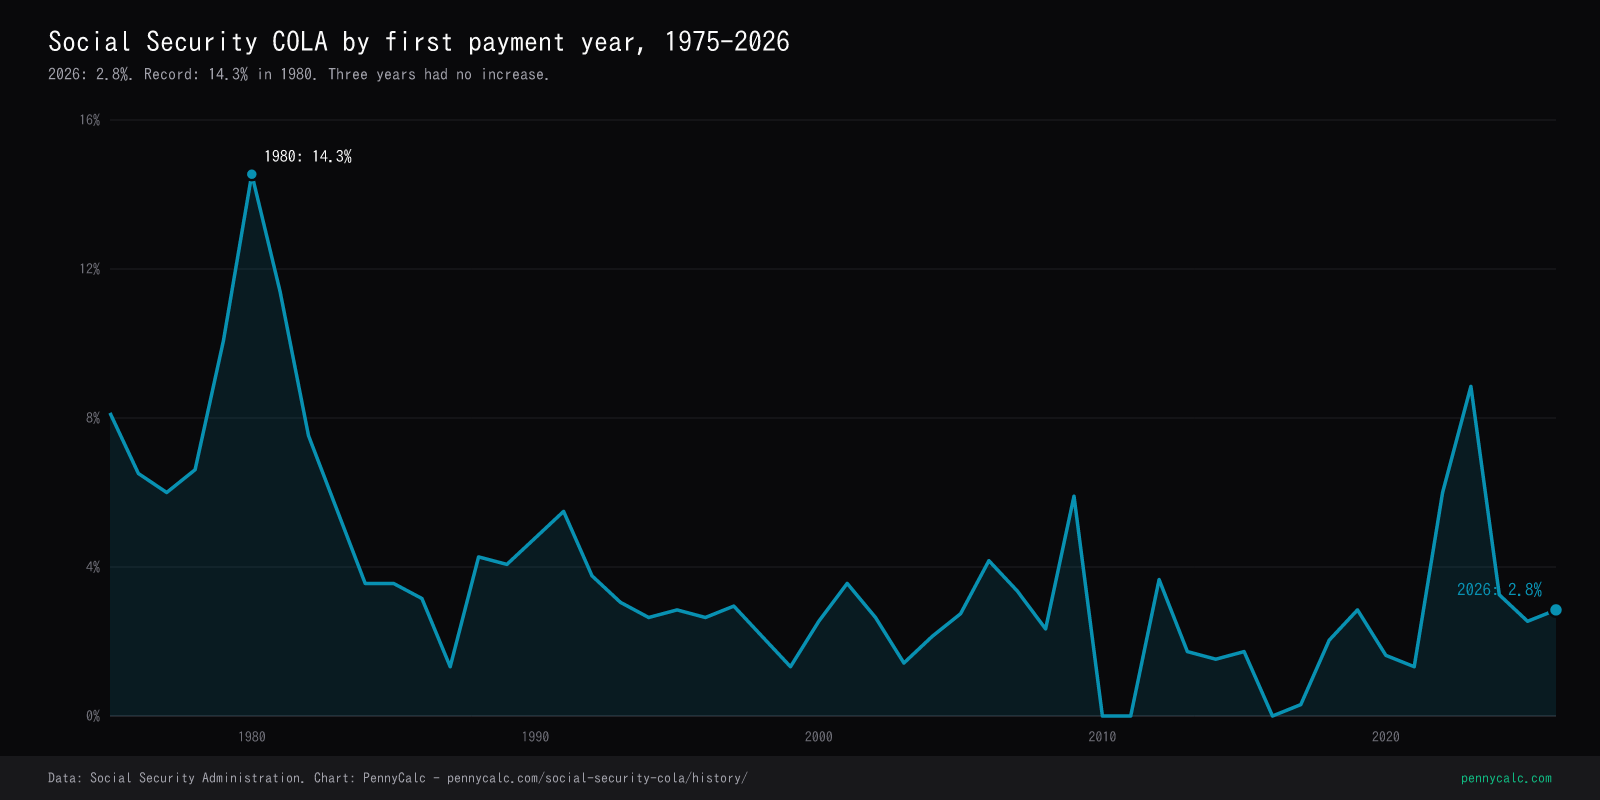
Download this chart: PNG light · PNG dark - PennyCalc chart artwork is reusable under CC BY 4.0 with attribution; source-data terms still apply. Licensing details.
The major changes
The COLA has been remarkably stable as a mechanism since 1975. The headline changes are not to the formula itself but to its timing, its trigger, and the recurring argument over whether it measures the right basket of goods.
The automatic COLA begins
Before 1975, raising Social Security benefits required an act of Congress, which meant increases were irregular and politically timed. Benefits often lagged inflation for years, then jumped when an election approached. The 1972 amendments replaced that with an automatic annual COLA tied to consumer prices, starting with the 8.0% increase paid in 1975. The reform took the raise out of politicians' hands and tied it to a formula.
The double-digit peak
Late-1970s inflation produced the two largest COLAs on record: 14.3% in 1980 and 11.2% in 1981. These were not generosity; they were the formula doing its job during a period when consumer prices were rising at double-digit rates. The size of these adjustments, combined with a flawed benefit formula from the 1972 amendments, helped push Social Security toward the funding crisis that the 1983 reforms had to fix.
The Greenspan reforms shift the timing
The 1983 amendments, drawn from the Greenspan Commission, moved when the larger checks arrive from July to the following January. This created a one-time six-month gap: the July 1982 raise was the last summer adjustment, and the next adjustment was effective in December 1983 and first paid in January 1984. The same law made up to half of Social Security benefits taxable for higher-income recipients, using thresholds that were never indexed and now affect many retirees.
The 3% trigger is removed
Originally, no COLA was paid unless inflation reached at least 3%. A 1986 change removed that floor, so any positive change in the index now produces a COLA, even a fraction of a percent. This is why 2017 saw a 0.3% adjustment rather than nothing. The change also set up the possibility of a 0% COLA in years when the index does not rise at all.
The first years with no raise
The 2008-09 spike and collapse in energy prices left the third-quarter price index lower than its previous peak. Because a COLA can never be negative, benefits stayed flat: 0% in both 2010 and 2011, the first zero adjustments since automatic COLAs began. A third 0% year followed in 2016. In each case, retirees received no raise while many of their actual costs, especially medical, kept rising.
The 8.7% pandemic-era raise
The post-pandemic inflation surge produced an 8.7% COLA in 2023, the largest since 1981. For a retiree receiving $2,000 a month, that was an extra $174 per check. The size of the adjustment renewed a long-running debate about whether the CPI-W, which weights the spending of working-age wage earners, accurately reflects what retirees actually buy.
Where the COLA stands today
The 2026 COLA is 2.8%, announced in October 2025 and reflected in benefit checks beginning January 2026. That matches the 2.8% average for payment years 1984-2026. The complete 1975-2026 series averages 3.7%, pulled higher by the double-digit inflation adjustments of 1979-1981. The next COLA, for 2027, will be set from third-quarter 2026 price data and announced in October 2026.
Things you might not know
- The calculation directly averages only three months of index readings. It uses CPI-W for July, August, and September, compared with the third-quarter average from the last year in which a COLA became effective. That is usually the prior year, but after a 0% COLA the comparison base can reach farther back. Price changes in other months can still affect the index level reached by the third quarter, but those months do not enter the two averages directly.
- A 0% COLA freezes more than the check. In years with no COLA, several thresholds tied to the adjustment also stay flat, and the hold-harmless math that protects Part B premiums becomes more important. The 2016 zero-COLA year forced a complicated set of premium rules to keep most retirees' net checks from falling.
- The CPI-E would usually, but not always, be higher. The experimental elderly index has averaged a couple of tenths of a percent higher than CPI-W over the long run, mostly because of medical and housing weights. But in years when energy prices spike, CPI-W can briefly run higher, since wage earners spend more on gasoline and commuting. The case for CPI-E is a long-run case, not a guarantee in any single year.
- The 1972 formula had a famous flaw. The original automatic-COLA formula double-counted inflation in the benefit calculation, over-indexing benefits for people retiring in the late 1970s. The 1977 amendments fixed it, but the fix created the so-called notch, where people born in 1917 through 1921 received somewhat lower benefits than those just before them. The notch generated decades of complaints and several failed bills to reverse it.
- SSI uses the same COLA, while other limits use different formulas. Supplemental Security Income payment standards generally receive the same percentage adjustment. The taxable wage base and retirement earnings-test limits are announced alongside the COLA but are based primarily on national average wage growth, not the COLA percentage itself.
Why the COLA feels smaller than it reads
The COLA applies to the gross Social Security benefit, but the change in a recipient's net deposit can differ because Medicare premiums, tax withholding, and other deductions may also change. The formula is backward-looking: it compares third-quarter CPI-W with the third quarter of the last year in which a COLA became effective, then applies the result to benefits beginning later. It is therefore an inflation adjustment based on a national index, not a guaranteed increase in purchasing power for every household. Retirement budgets should compare the gross COLA with the recipient's actual premiums, deductions, and spending mix.
Frequently Asked Questions
What is the 2026 Social Security COLA?
What were the Social Security COLAs for the last 10 years?
How is the COLA calculated?
What was the highest and lowest COLA ever?
Why do retirees say the COLA understates their costs?
Does the Medicare premium reduce my COLA?
How did benefit increases work before 1975?
The COLA adjusts benefits funded by the Social Security wage base, and most retirees see it net of the Medicare Part B premium. To build it into a drawdown plan, use the retirement calculator. For sources and update cadence, see our methodology.
Related Calculators
Social Security Wage Base History
The taxable maximum that funds the benefits the COLA adjusts.
Retirement Calculator
Model an inflation-adjusted drawdown with a Social Security offset.
Medicare Premium History
The Part B premium that is deducted from most benefit checks.
Tax Bracket Calculator
See how taxable Social Security stacks with other retirement income.
Compound Interest Calculator
Project how an inflation-adjusted income stream compounds over a retirement.
Methodology
How we source and verify every rate, limit, and bracket.
Educational content only. COLA figures come from the Social Security Administration; tables show both SSA's effective-year label and the first-payment-year label. Benefit-impact examples use gross amounts before premiums and deductions. Consult SSA for decisions specific to your situation.