Wages, income, and inflation
Are we earning more, or do the numbers just look bigger?
PennyCalc · Last updated: · Data through 2025
A bigger paycheck should mean more room in your budget. But comparing salaries across decades gets confusing quickly: prices change, averages can pull away from the middle, and a household can have more than one earner. We wanted to see those differences together, so we put five measures on the same inflation basis.
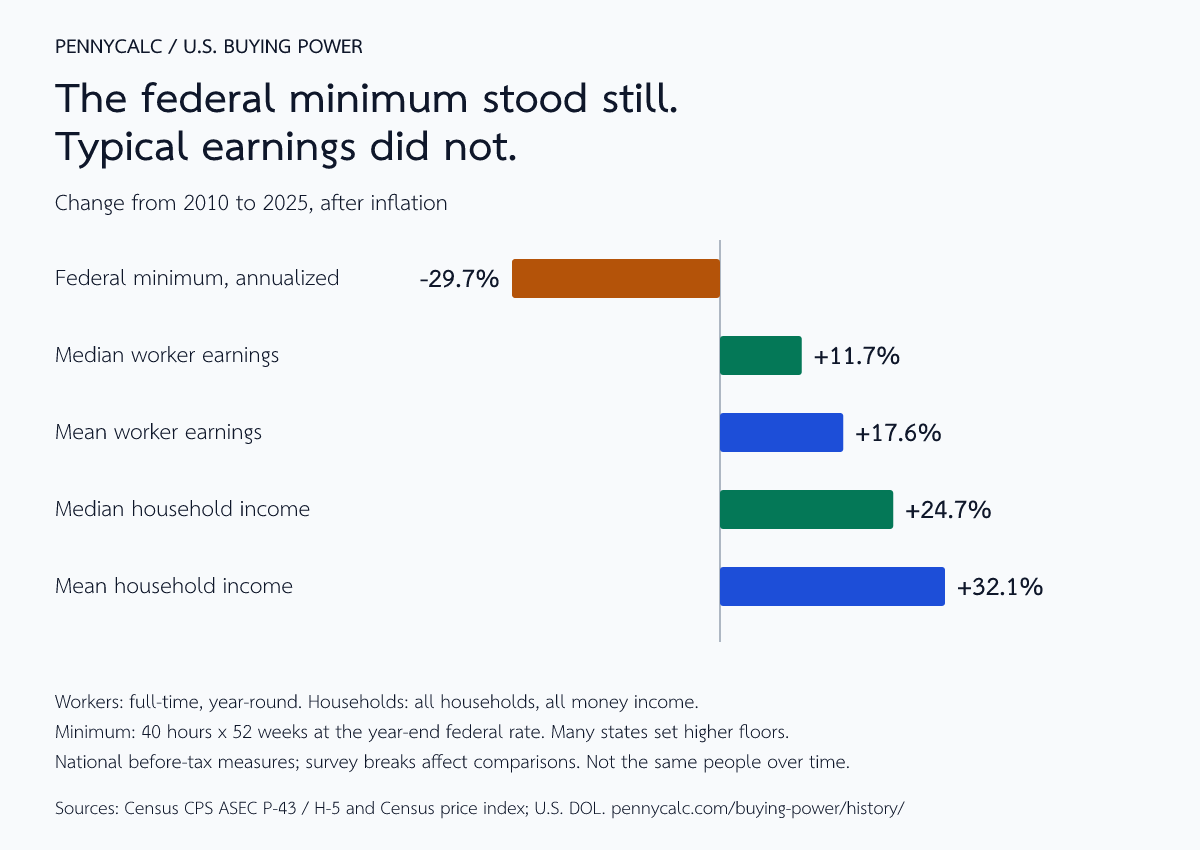
The clearest split since 2010 is between the federal minimum wage and typical earnings. The federal floor has lost about 30% of its buying power, while median earnings for full-time, year-round workers are about 12% higher after inflation. Household income has risen more, though it measures a different thing.
Five measures, two different perspectives
Showing 1974 to 2025 in 2025 dollars. The charts use separate vertical scales.
One worker: minimum, median, and mean earnings
Median and mean cover full-time, year-round workers. The federal minimum is an illustrative 40-hour week for 52 weeks at each year-end rate.
- Federal minimum, annualized
- Median worker earnings
- Mean worker earnings
Scroll the chart sideways to see every year. Exact amounts are in the annual data table.
One household: median and mean income
Household income combines money income across household members, including sources beyond earnings.
- Median household income
- Mean household income
Scroll the chart sideways to see every year. Exact amounts are in the annual data table.
What changed since 2010?
We use 2010 here because it was the first full calendar year with a $7.25 federal minimum. It was also just after a recession, so it is a starting point with consequences. Use the chart controls to see how the comparison changes over a longer period.
| Measure | 2010 | 2025 | Change |
|---|---|---|---|
| Federal minimum, annualized | $21,455 | $15,080 | -29.7% |
| Median worker earnings | $59,650 | $66,620 | +11.7% |
| Mean worker earnings | $78,410 | $92,220 | +17.6% |
| Median household income | $70,110 | $87,460 | +24.7% |
| Mean household income | $95,880 | $126,700 | +32.1% |
The middle has gained buying power too
The gains are not confined to the average. Median earnings for full-time, year-round workers rose from $59,650 to $66,620 in 2025 dollars, an increase of 11.7%. The worker at the middle of this earnings distribution earned more after inflation in 2025 than the middle worker did in 2010.
That is a useful sign of progress, but it does not mean everyone got a raise or that the same worker was better off. These are two population snapshots, and the group excludes people working part time or for only part of the year.
The average is pulling further ahead of the middle
Mean worker earnings grew 17.6% after inflation, compared with 11.7% for the median. In 2010, the mean was 31.5% above the median; by 2025 it was 38.4% above it. Household income shows a similar widening: its mean grew 32.1%, while its median grew 24.7%.
That pattern is consistent with higher earners pulling away from the middle. A large increase for someone near the top lifts the average without necessarily moving the median. So yes, the middle can gain buying power while the average pulls further ahead.
These five lines alone cannot establish that the highest earners captured most of the gains. Changes lower in the distribution, who works, household composition, and survey methods can also affect the gap. Our income-distribution history follows up with CBO income shares: how much goes to the top 1%, how taxes and benefits change the picture, and what might explain the shifts. It uses a broader income definition, so its figures should not be spliced into these Census lines.
A much bigger paycheck can mean a modest gain in buying power
Before adjusting for prices, median worker earnings rose from $41,920 to $66,620, or 58.9%. After inflation, the increase was 11.7%. Both numbers describe the same change. The first is the growth in the paycheck; the second asks how much more it could buy using the Census price index.
This helps explain why a salary that sounds much higher than an older one may not feel dramatically better. It still does not describe every budget: rent, childcare, healthcare, and other costs do not all move with the national price index.
The federal minimum tells a much narrower story
A worker earning the federal floor for 2,080 hours would receive $15,080 before taxes. That dollar amount has not changed since 2009. It buys less now, but it is not a measure of what all low-paid workers earn: many states and cities set higher minimums, and coverage and exceptions matter. Our federal minimum-wage history shows the changes behind this line.
On this inflation measure, matching the buying power of the 2010 federal minimum would take about $10.32 an hour in 2025. That is a price-adjusted comparison, not a proposed wage or an estimate of a local living wage.
A household is not just a worker with a higher salary
Households may contain several earners, people who are retired, or someone working part time. Their income can include Social Security, interest, and other cash sources. Household size and the number of earners also change over time, so the higher household growth does not establish that the same person became that much better off.
These are national, before-tax comparisons. Housing costs, local prices, benefits, and taxes can make your own experience quite different. The inflation calculator helps translate dollar amounts across years; the take-home pay map compares modeled current taxes across states. For savings tied to inflation, our I Bond comparison shows how the purchase year affects the current rate.
Sources and methodology
The annual series runs from 1974, the first year shared by the selected earnings table, through 2025, the latest completed income year in the Census release checked on September 21, 2026. We keep individual earnings and household income in separate charts because their populations and income definitions differ.
- Individual earnings: Census Table P-43, “Worked Full-Time, Year-Round,” both sexes. Earnings include wage and salary income and net self-employment earnings. This is not total personal income. The Census definition uses 35 or more hours per week during a majority of weeks worked, and at least 50 weeks in the year; it does not imply that everyone worked exactly 2,080 hours.
- Household income: Census Table H-5, all races. Money income is measured before personal income taxes and excludes capital gains and noncash benefits. The median divides the population in half; the mean is total income divided by the number of households or workers in the selected population.
- Federal minimum: the Department of Labor’s historical rate in effect at each year-end, multiplied by 40 hours and 52 weeks. This is an annualized benchmark, not an estimate of earnings actually received in years with a midyear increase. Earlier coverage expansions had different rates; this line follows the rate for workers originally covered by the 1938 Act.
- Inflation: the income lines use Census’s published 2025-dollar columns. We convert the minimum-wage benchmark using the same Census annual price series: annualized pay × 2025 index ÷ that year’s index. It combines C-CPI-U from 2000, R-CPI-U-RS for 1978-1999, and CPI-U-X1 for our earlier years. The 2025 index includes Census’s approximation for the missing October observation. Published rounding can produce small differences when reconstructing the income columns.
- Survey breaks: we select the redesigned-questionnaire estimate for 2013 and the updated-processing estimate for 2017. We do not splice the series to remove those breaks. Changes in age coverage, population controls, collection, and processing also affect comparisons. The Census historical footnotes document these changes; the JSON retains the source labels and row numbers.
The growth view sets each line to 100 in the selected starting year after inflation. It compares percentage changes, not dollar levels. These are repeated population estimates, not a panel tracking the same people. We have not calculated confidence intervals, and the charts cannot isolate the effect of a policy or explain what caused a change.
Our minimum-wage history page uses CPI-U and includes a labeled 2026 estimate. This comparison stops at 2025 and follows Census’s inflation method throughout, so its real-dollar figures will differ. Future updates will replace the source tables together and recheck revisions before changing the “last updated” date.
See the annual data, 1974-2025
All amounts below are annual 2025 dollars, regardless of the chart setting. Nominal amounts and source notes are in the downloads.
| Year | Federal minimum, annualized | Median worker earnings | Mean worker earnings | Median household income | Mean household income |
|---|---|---|---|---|---|
| 2025 | $15,080 | $66,620 | $92,220 | $87,460 | $126,700 |
| 2024 | $15,452 | $65,250 | $90,570 | $85,210 | $123,600 |
| 2023 | $15,852 | $64,580 | $87,560 | $84,730 | $120,400 |
| 2022 | $16,472 | $65,620 | $87,740 | $81,460 | $116,200 |
| 2021 | $17,741 | $66,440 | $90,060 | $83,270 | $120,400 |
| 2020 | $18,534 | $69,160 | $92,490 | $83,590 | $119,800 |
| 2019 | $18,727 | $64,580 | $88,960 | $85,320 | $121,800 |
| 2018 | $19,004 | $63,830 | $85,210 | $79,620 | $113,400 |
| 2017 | $19,387 | $63,970 | $84,060 | $78,600 | $112,700 |
| 2016 | $19,728 | $61,720 | $83,730 | $77,230 | $108,800 |
| 2015 | $19,902 | $61,190 | $81,650 | $74,590 | $104,600 |
| 2014 | $19,888 | $59,350 | $78,180 | $70,760 | $99,880 |
| 2013 | $20,171 | $58,840 | $78,730 | $71,670 | $100,600 |
| 2012 | $20,415 | $57,940 | $78,730 | $69,070 | $96,490 |
| 2011 | $20,809 | $58,080 | $78,860 | $69,070 | $96,150 |
| 2010 | $21,455 | $59,650 | $78,410 | $70,110 | $95,880 |
| 2009 | $21,750 | $59,830 | $79,000 | $71,790 | $98,040 |
| 2008 | $19,571 | $58,940 | $77,430 | $72,260 | $98,290 |
| 2007 | $18,120 | $60,040 | $76,780 | $74,810 | $100,700 |
| 2006 | $16,361 | $58,790 | $77,910 | $73,620 | $101,700 |
| 2005 | $16,836 | $58,010 | $77,120 | $72,810 | $99,560 |
| 2004 | $17,323 | $58,570 | $76,510 | $71,700 | $97,790 |
| 2003 | $17,757 | $59,340 | $76,950 | $71,810 | $97,920 |
| 2002 | $18,127 | $59,290 | $77,010 | $71,770 | $97,900 |
| 2001 | $18,353 | $57,630 | $76,810 | $72,350 | $99,730 |
| 2000 | $18,767 | $56,510 | $75,490 | $73,560 | $100,100 |
| 1999 | $19,414 | $57,070 | $73,750 | $73,760 | $99,200 |
| 1998 | $19,816 | $56,920 | $72,350 | $71,930 | $95,930 |
| 1997 | $20,086 | $56,450 | $70,890 | $69,390 | $93,180 |
| 1996 | $18,923 | $54,200 | $69,950 | $67,980 | $90,260 |
| 1995 | $17,379 | $53,370 | $68,400 | $66,990 | $88,340 |
| 1994 | $17,790 | $53,680 | $68,600 | $64,930 | $86,800 |
| 1993 | $18,178 | $53,720 | $67,670 | $64,240 | $85,190 |
| 1992 | $18,629 | $54,460 | $64,870 | $64,560 | $81,850 |
| 1991 | $19,102 | $54,390 | $64,280 | $65,100 | $81,940 |
| 1990 | $17,700 | $53,920 | $64,680 | $67,050 | $83,760 |
| 1989 | $16,362 | $54,790 | $66,640 | $67,880 | $85,760 |
| 1988 | $17,081 | $54,500 | $65,400 | $66,740 | $83,390 |
| 1987 | $17,712 | $54,710 | $65,110 | $66,250 | $82,390 |
| 1986 | $18,311 | $55,050 | $64,690 | $65,430 | $80,830 |
| 1985 | $18,613 | $53,970 | $62,720 | $63,090 | $77,640 |
| 1984 | $19,245 | $53,210 | $61,200 | $61,910 | $75,850 |
| 1983 | $20,051 | $51,970 | $60,520 | $60,100 | $73,090 |
| 1982 | $20,892 | $51,760 | $60,500 | $60,480 | $72,890 |
| 1981 | $22,156 | $52,260 | $60,230 | $60,650 | $72,460 |
| 1980 | $22,461 | $53,390 | $61,050 | $61,690 | $73,370 |
| 1979 | $23,332 | $54,040 | $62,920 | $63,670 | $75,630 |
| 1978 | $23,341 | $54,730 | $63,350 | $63,790 | $75,080 |
| 1977 | $21,643 | $54,870 | $62,610 | $61,400 | $72,840 |
| 1976 | $23,043 | $54,670 | $62,360 | $61,100 | $71,870 |
| 1975 | $22,238 | $54,730 | $61,520 | $60,080 | $70,150 |
| 1974 | $22,944 | $55,420 | $62,680 | $61,760 | $72,220 |