Historical 30-Year Mortgage Rates by Year
Last verified: August 21, 2026 against Freddie Mac PMMS through August 20, 2026
Reviewed by Michael for implementation and test coverage. See more by Michael.
The latest Freddie Mac 30-year fixed rate is 6.65% as of August 20, 2026. The 2026 year-to-date average is 6.35%; the table and chart below cover annual averages from 1972 through 2025 and label the partial 2026 period separately.
Official sources: Freddie Mac PMMS, 30-year FRED series, and 15-year FRED series.
Historical mortgage rates at a glance
In the PMMS series, the 30-year rate reached a weekly high of 18.63% in 1981 and a weekly low of 2.65% in 2021. Those single-week records are different from the annual averages shown in the year table.
Latest week
6.65%
30-year fixed on August 20, 2026
2026 YTD average
6.35%
33 weekly readings through August 20, 2026
Weekly record high
18.63%
October 9, 1981
Weekly record low
2.65%
January 7, 2021
| Year | Average rate | Coverage |
|---|---|---|
| 2026 | 6.35% | YTD through August 20, 2026 |
| 2025 | 6.60% | Full calendar year |
| 2024 | 6.72% | Full calendar year |
| 2023 | 6.81% | Full calendar year |
| 2022 | 5.34% | Full calendar year |
| 2021 | 2.96% | Full calendar year |
| 2020 | 3.11% | Full calendar year |
Swipe horizontally to explore the full timeline. Tap the chart to read an exact value.
Download this chart: PNG light · PNG dark - PennyCalc chart artwork is reusable under CC BY 4.0 with attribution; source-data terms still apply. Licensing details.
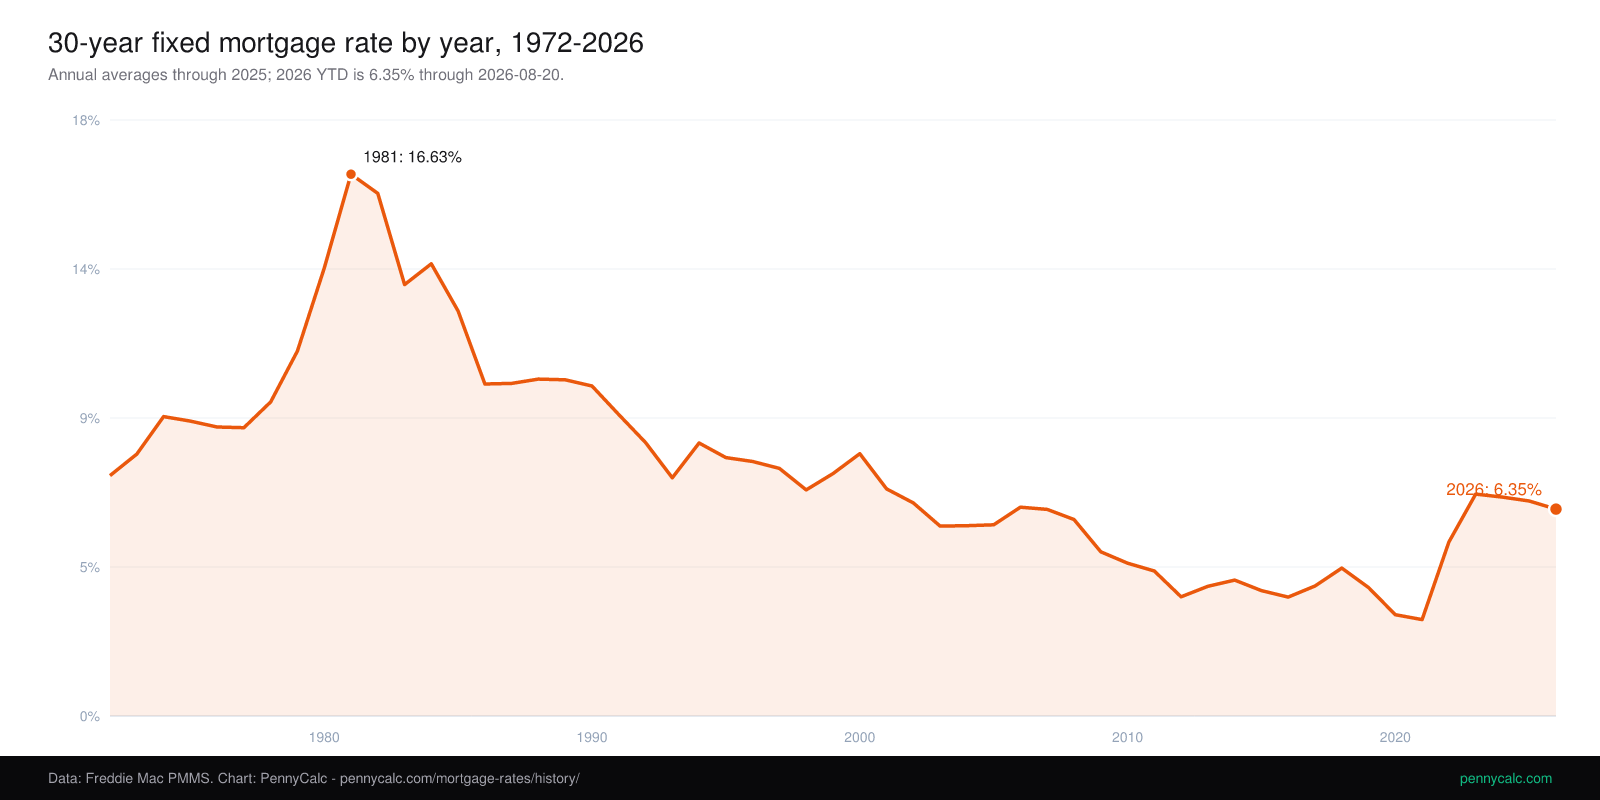
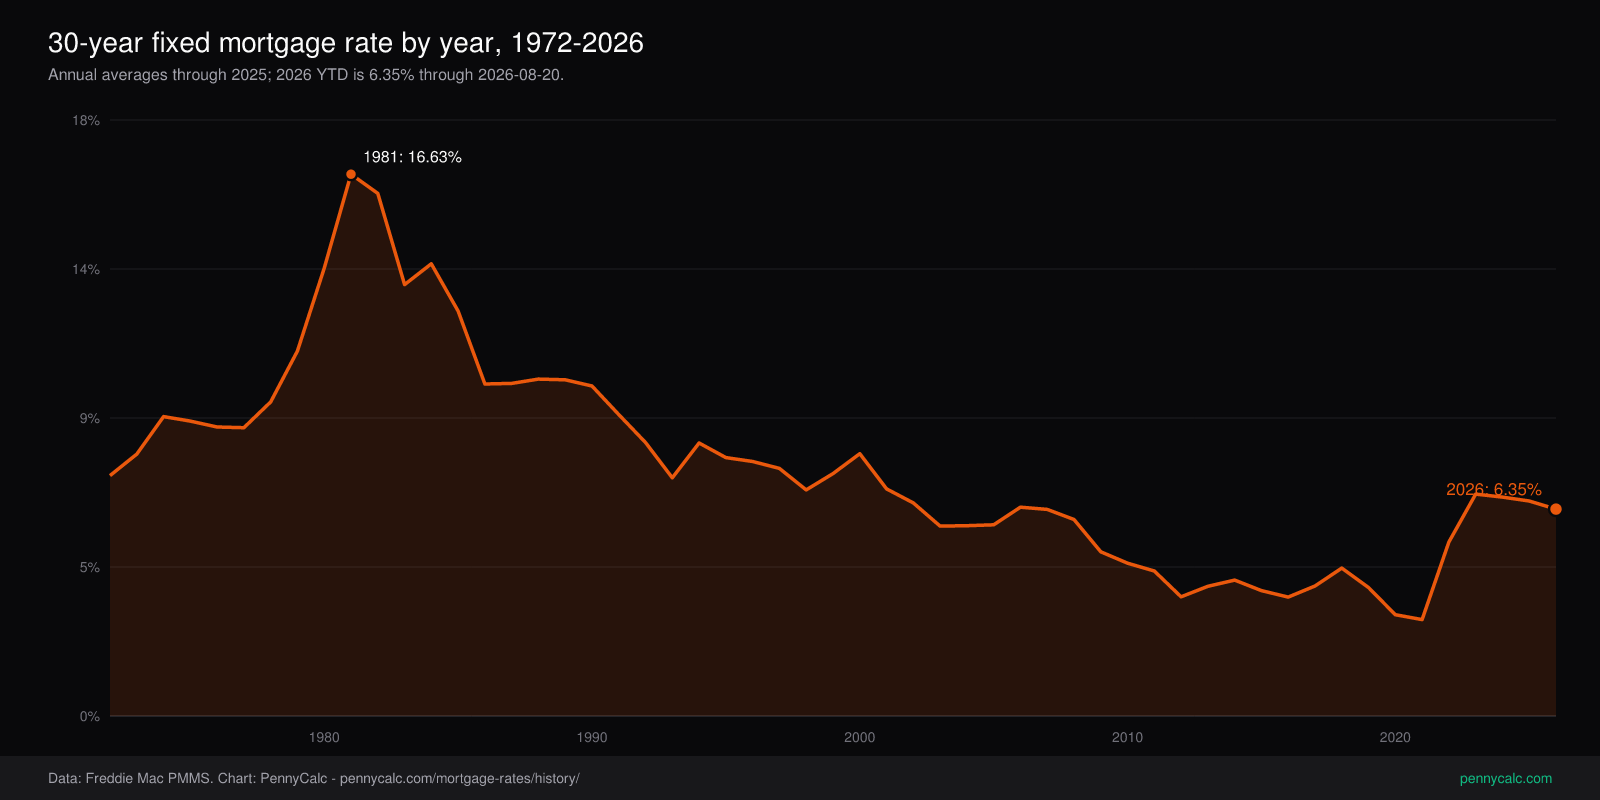
The chart's 2026 point is the YTD average (6.35%), not the latest weekly reading (6.65%).
Explore mortgage rates by timeframe
Switch between the official 30-year and 15-year series, then view annual, monthly, or weekly data.
| Period | Rate |
|---|
What drove mortgage rates over time?
Mortgage rates respond to longer-term Treasury yields, inflation expectations, monetary policy, and mortgage-backed-security spreads. The PMMS series supplies a consistent long-run benchmark, but it is not a personalized lender quote.
Inflation and the record peak
The first full-year PMMS average was 7.38% in 1972. Inflation, oil shocks, and tight monetary policy then pushed the 1981 annual average to 16.63%. The weekly series reached its record 18.63% on October 9, 1981.
A long disinflationary decline
As inflation expectations receded, the annual average fell from 16.04% in 1982 to 6.34% in 2007. The path was uneven, but each major cycle generally produced lower rate peaks and troughs.
Financial crisis and quantitative easing
The Federal Reserve cut short-term rates and purchased mortgage-backed securities after the financial crisis. The 30-year annual average fell below 5% in 2010 and remained below 5% through 2021.
Pandemic-era record low
Emergency monetary policy and mortgage-backed-security purchases pushed the weekly PMMS rate to its record low of 2.65% on January 7, 2021. The full-year 2021 average was 2.96%.
The inflation reset
The annual average jumped to 5.34% in 2022 and 6.81% in 2023 as inflation and Treasury yields rose. It averaged 6.72% in 2024 and 6.60% in 2025. Through August 20, 2026, the 2026 YTD average is 6.35%; the latest weekly reading is 6.65%.
Sources and methodology
Weekly observations come from Freddie Mac's Primary Mortgage Market Survey as distributed by FRED. The 30-year annual series uses Freddie Mac's published annual averages through 2024; we calculate 2025 and 2026 from the official weekly observations. Monthly values and the 15-year annual series are arithmetic means of weekly observations in each calendar period. The 2026 value is YTD through August 20, 2026; it is not a forecast or completed-year average.
Freddie Mac changed the PMMS collection method on November 17, 2022, moving from a lender survey to mortgage application data submitted through Loan Product Advisor. That methodology break matters when comparing periods. Read the official PMMS methodology.
Download the mortgage-rate history data
Each file includes both 30-year and 15-year fixed rates where the official series is available.
More granular CSV files
30-year fixed mortgage rate by year
Calendar-year averages from 1972 through 2025. The 2026 row is the YTD average through August 20, 2026; the separate latest weekly rate is 6.65%.
| Year | Average rate | What changed that year |
|---|---|---|
| 1972 | 7.38% | Freddie Mac PMMS survey begins (1971) |
| 1973 | 8.04% | |
| 1974 | 9.19% | |
| 1975 | 9.05% | |
| 1976 | 8.87% | |
| 1977 | 8.85% | |
| 1978 | 9.64% | |
| 1979 | 11.2% | Volcker named Fed Chair, begins inflation fight |
| 1980 | 13.74% | |
| 1981 | 16.63% | Modern peak: 16.63% annual average |
| 1982 | 16.04% | |
| 1983 | 13.24% | |
| 1984 | 13.88% | |
| 1985 | 12.43% | |
| 1986 | 10.19% | Tax Reform Act of 1986 - mortgage interest deduction preserved |
| 1987 | 10.21% | |
| 1988 | 10.34% | |
| 1989 | 10.32% | |
| 1990 | 10.13% | |
| 1991 | 9.25% | |
| 1992 | 8.39% | |
| 1993 | 7.31% | |
| 1994 | 8.38% | |
| 1995 | 7.93% | |
| 1996 | 7.81% | |
| 1997 | 7.6% | |
| 1998 | 6.94% | |
| 1999 | 7.44% | |
| 2000 | 8.05% | |
| 2001 | 6.97% | |
| 2002 | 6.54% | |
| 2003 | 5.83% | |
| 2004 | 5.84% | |
| 2005 | 5.87% | |
| 2006 | 6.41% | |
| 2007 | 6.34% | |
| 2008 | 6.03% | Financial crisis - Fed cuts rates to zero |
| 2009 | 5.04% | |
| 2010 | 4.69% | |
| 2011 | 4.45% | |
| 2012 | 3.66% | |
| 2013 | 3.98% | |
| 2014 | 4.17% | |
| 2015 | 3.85% | |
| 2016 | 3.65% | |
| 2017 | 3.99% | |
| 2018 | 4.54% | |
| 2019 | 3.94% | |
| 2020 | 3.11% | Pandemic-era Fed action drives rates to record lows |
| 2021 | 2.96% | Modern low: 2.96% annual average |
| 2022 | 5.34% | Fed begins aggressive tightening to fight inflation |
| 2023 | 6.81% | |
| 2024 | 6.72% | |
| 2025 | 6.6% | |
| 2026 | 6.35% | Year-to-date average through August 20, 2026; latest weekly reading 6.65% |
Full series shown. Scroll within the table to see every year.
Mean of completed annual averages, 1972-2025: 7.7%. This is historical context, not a prediction or borrower-specific quote.
Frequently Asked Questions
What was the highest 30-year mortgage rate in U.S. history?
What was the lowest 30-year mortgage rate ever?
What is the average mortgage rate in 2026?
How are the yearly and monthly mortgage rates calculated?
How does the 15-year fixed rate compare with the 30-year rate?
Why did mortgage rates rise so quickly in 2022?
Run a purchase scenario in the mortgage payment calculator, or estimate a budget with the home affordability calculator.
Related Calculators
Mortgage Calculator
Calculate monthly payment, total interest, and amortization at any rate.
Home Affordability Calculator
Use income and debt ratios to estimate a home-price range.
U.S. Home Price History
Compare the national median home price with the rate environment by year.
State Tax & Housing Comparison
Compare property tax and income tax across all 50 states.